Go FAR beyond bivariate drivers with Driver Maps! Take a quantum leap in your driver analyses’ insights: See drivers of drivers, paths of driver influence, and what drivers work together and in what way.

Level-up the differentiated value you provide your client’s with Driver Maps! Answer more questions and provide direction that has more impact and deeper insights. Use this natural path to increase value and differentiate your proposals.
We help companies like yours

Interactive Driver Maps for Smarter Decision-Making

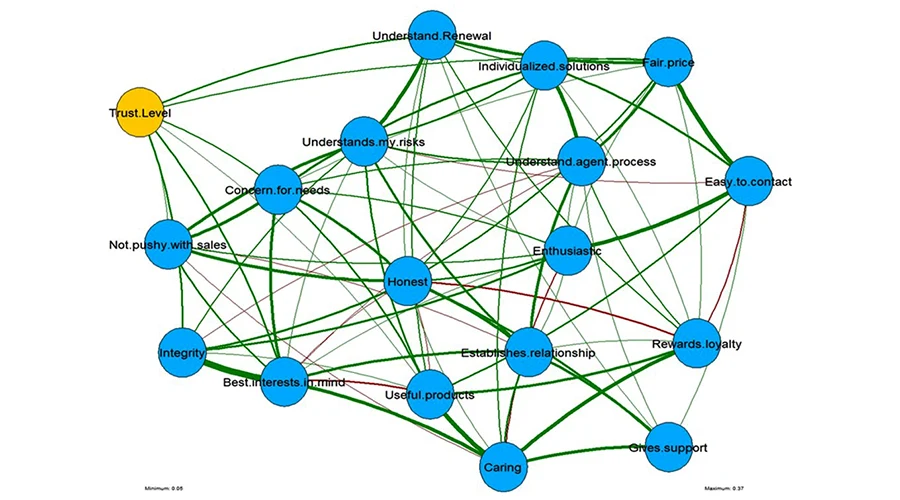
Driver Maps help you understand how different drivers influence each other and impact results. They visually show the relationships between drivers so you can see which ones matter most and how they work together. With interactive Driver Maps, you can focus on specific questions and adjust the view to match your goals. The Driver Map Simulator allows you to explore different paths of influence and identify the most effective combinations of drivers. This helps you make smarter decisions by focusing your efforts where they will create the greatest impact.

From Simplistic Drivers to True Business Insight

Traditional bivariate analyses (e.g., correlations or simple regressions) are a helpful starting point but fail to capture interactions between drivers, limiting insight and accuracy.

In your client service Driver Maps are one of the best ways to deepen your client relationships by offering added value and insights.

Differentiate Driver Maps’ outreach by showcasing what makes you unique, sparking interest, and adding clear value to every interaction and proposal.

Driver Maps are a natural upsell for clients familiar with driver analyses, offering a clear path to deeper insights and an elevated approach to driver work.

Driver Map Methodologies and Analytical Approaches

Driver Maps are analytical tools used to understand relationships among variables. They can be built using different levels of analysis, depending on the goal of the study.

Correlation Analyses

These driver maps look at every 2-way correlation and construct a visual map that represents the relationships and clusters of highly associated drivers.

Partial Correlation Analyses
Popular in Driver Maps, this method examines each 2-way relationship while removing the influence of other variables. It provides a clear, “independent” view of each driver, making it easier to understand how multiple drivers combine along a path of influence.
Causal Drivers
Causal Drivers
Using advanced forms of LiNGAM analyses (Linear Non-Gaussian Acyclic Model) examine conditional distribution relationships between drivers to determine causality and assess combined causal directionality and impact. These are the tool to use for Root Cause analyses and more predictive work.

Driver Maps vs. Structural Equation Modeling (SEM)

Driver Maps are like a more exploratory version of structural equation modeling (SEM). SEM is confirmatory in nature and which means you need to have a strong incoming hypothesis of the structure of the map and relationships between the inputs. You then can refine and test this structure versus others you have in mind. Driver Maps allow the data to tell us the structure. They overlap in many, but not all, applications. Often when a client asks about SEM, they would benefit more from Driver Maps.

Driver Map Outputs & Benefits

Driver Maps are analytical tools used to understand relationships among variables. They can be built using different levels of analysis, depending on the goal of the study.

Browser-Based Interactive Map Features
You receive a table of driver values that shows you the direct and indirect driver “power” of each input for a given DV (dependent variable – the measure you are trying to influence, like purchase intent).
map simulator_orig
Features of Interactive Driver Maps
The interactive driver maps themselves that work in your browser. Users interact, rearrange, edit, reshape, etc the maps in this interface. The user can save this new version for further editing later. The user can also save out the coordinates of the map and the matrix of driver relationships between all of the driver measures on the map. The user can also save the map as a graphic image
Key Functions of the Simulator

1. Driver Analysis: Interact with the driver value table to choose a DV and explore its direct and indirect drivers, with multi-level maps for multiple measures.

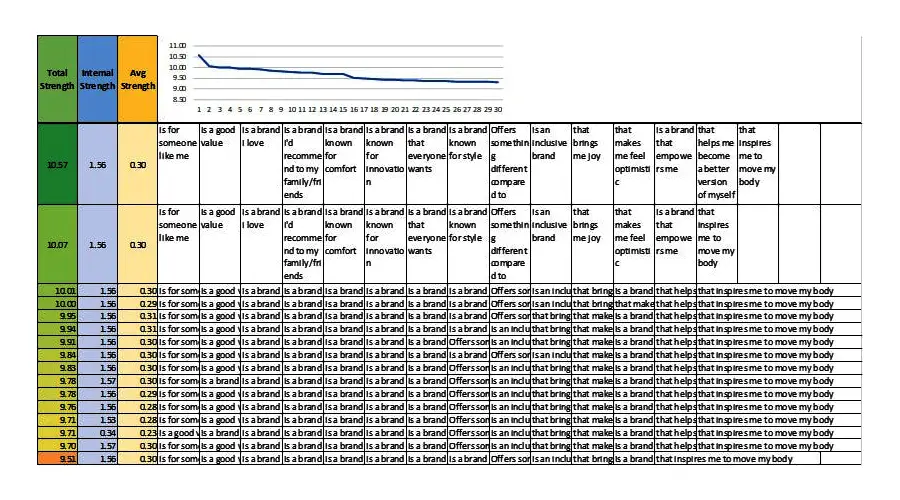
2. Path Optimization: Search for the optimal sequence of drivers, including functional and emotional paths to purchase.

3. Key Driver Groups: IIdentify influential driver groups whose combined impact and interconnections reveal insights into consumer behavior and guide communication strategies.

driver map_orig

Want to see this with your data? Request a demo and we’ll run a short mapping and show a live simulation.

Why The Analytics Team

With over 5 years of hands-on experience using Driver Maps, our Analytics Team knows these tools inside and out. We’ve tested multiple approaches and understand what works best. As one of the pioneers in applying these innovative market research tools, we’re your trusted partner for uncovering insights and crafting solutions that truly impact your business.

Pricing Information

Mapping Made Simple – Costs That Scale With Your Needs.

Pricing and Details

But it all depends on the number of subgroups, map input sets, and the need for the simulator.

Frequently Asked Questions

Your questions, answered — support, timelines, and project guidance made simple.

1. Why Driver Maps instead of typical drivers?
Typical drivers are “bi-variate,” showing each driver’s individual impact. They give a good overview but don’t show inter-relationships or what drives a strong driver. Driver Maps reveal these connections, showing how multiple factors work together to create impact. They also solve collinearity issues, separating overlapping effects to provide accurate insights on which drivers to focus on.
Shapley Value and Ridge Regression are approaches to sort out the collinearity issues. They are approaches to getting more accurate individual driver values, trying to average out the confounding effects of the other inputs or drivers. They each have their drawbacks but they are trying to address the confounding problem that Driver Maps inherently or by-design already solve and in addition to solving the problem the Driver Maps show what is going on and provide the essential insights for these inter-relationships or how some drivers drive others or how some drivers need to act in association with others to have an impact.

Overlaying performance with driver importance helps prioritize where to act. Drivers that are important but already performing well may need less attention, while important drivers with low performance require focus. Prioritization also depends on competitor performance—areas where competitors excel are high-priority threats, while areas where they lag may be opportunities. This approach informs both strategic and tactical decisions.

Driver Maps typically take a week to estimate, and if a simulator is part of the deliverable, it can be done in the same period.

Sign up now for our free “crazy good analytics” blog posts

Every couple of months, receive insightful blog entries that use case studies, examples and demonstrations to show you how to get the most out of your advanced analytics and to see dangers you can avoid. This is a new series of posts that come directly from real experience happening right now!

What Our Clients Say

President
small research firm
Work has only just finished and landed well! I appreciated the way you guys were able to flex on the project and give me a few different types of outputs. We ended up using them all in some way or another. Your outputs were easy to use too! Will definitely reach out the next time a need arises!
Senior project manager
The project went well overall, with the client finding the insights we pulled from the simulator actionable. The process of receiving the simulator files (and updated files as we found adjustments needed) was very efficient, with Grant very helpful along the way.
Senior project manager
Overall this project went really well from our perspective. We appreciate the quick turnaround on the deliverables and appreciate the team for helping us address the client's concerns and explaining the methodological details.
Senior project director
I regrouped with the team and we all agree that the process was very smooth! The team appreciates how helpful you are in aiding us in answering the client's technical questions, how you make sure the analyses will answer the client's business objectives, and just how flexible you are with timing. Thank you for your partnership on this one!
Consultant
Thanks for the follow up on this. As always, it is great working with you and your team. I really have no complaints about this projects, especially as it was a rush for Q4… we got it done and the client was super satisfied.
Research manager
The process was super efficient and the communication super clear. Thanks again and looking forward to working with the team in the future!
Partner
The [client] price laddering was super smooth. We like this addition to questionnaire when clients want a little toe dip into pricing but can't really do a full fledged pricing study. I honestly felt like everything went great and can't think of improvements on this one.