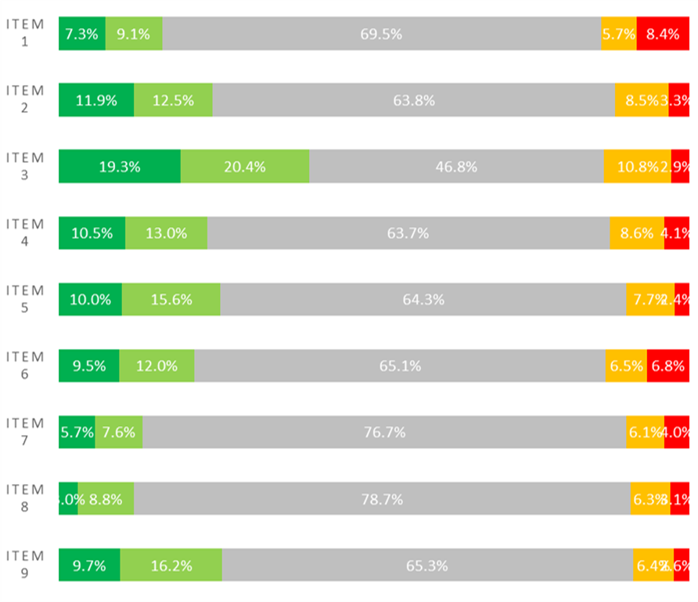
Go beyond standard driver tables with the full Advanced Analytics suiteMaxDiff, TURF, Relative Importance, Correspondence Maps, KANO, Q-Sort, and more.

Powerful techniques. Client-ready outputs. Delivered fast — so your team can win proposals, add value on every study, and give clients the strategic depth they didn’t know they were missing.

We help companies like yours

Turn Data Into Confident Business Decisions With Advanced Analytics Services

Go beyond basic tables and cross-tabs with advanced analytics that reveal what truly drives decisions. From prioritization and portfolio optimization to perceptual mapping and simulation, these methods turn data into clear, strategic direction your clients can act on.

Client-ready outputs. Fast turnaround. Real decision impact.

Turn Data Into Strategy — Not Just Insights

Standard analysis tells you what happened.

What truly drives customer behavior
How to optimize product portfolios
Which features and messages matter most
Where your brand stands against competitors
How customers make decisions
What changes will create the biggest impact

Each method is designed to move beyond reporting and into decision-making.

Advanced Analytics Methods We Offer

Identify what matters most with clear, discriminating results.

MaxDiff Analysis

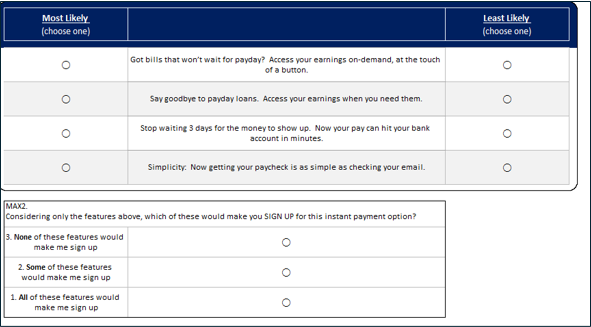
Best–Worst Scaling

MaxDiff
Best for
Feature prioritization
Message testing
Brand attribute
Deliverables
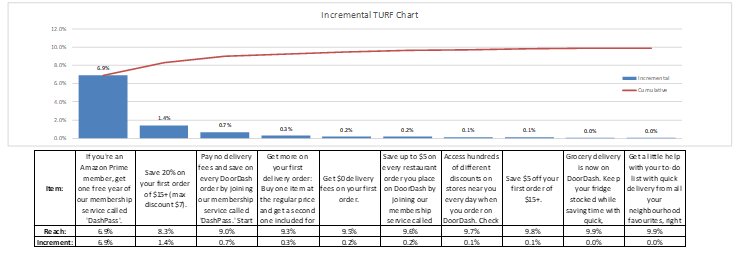
TURF Analysis

Portfolio Optimization

Turf
Best for
Product line optimization
Media/channel mix
Feature bundling
Feature bundling
Includes
Driver Analysis

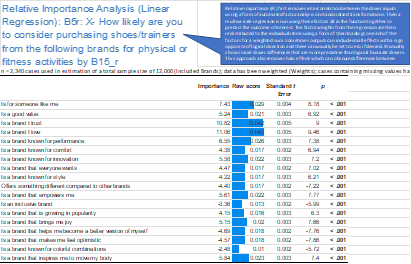
Relative Importance

Drivers
Best for
Customer satisfaction drivers
Purchase intent drivers
Brand performance analysis
Output
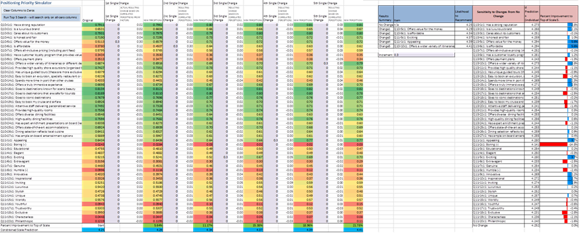
Next Best Change

Simulation

What makes it powerful
Goes beyond 'importance' → shows actual impact
Prioritizes changes that move the market
Simulates real decision outcomes
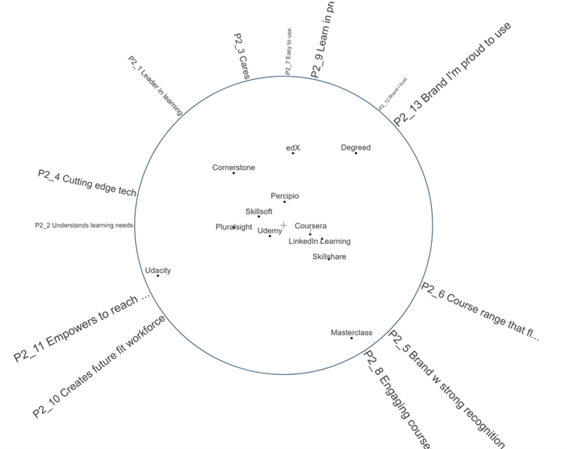
Perceptual Mapping

Correspondence Analysis

Includes
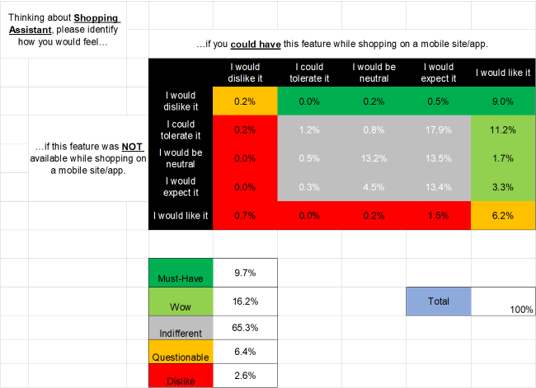
KANO Analysis

Feature Satisfaction Impact

Q-Sort Methodology

Structured Preference Capture

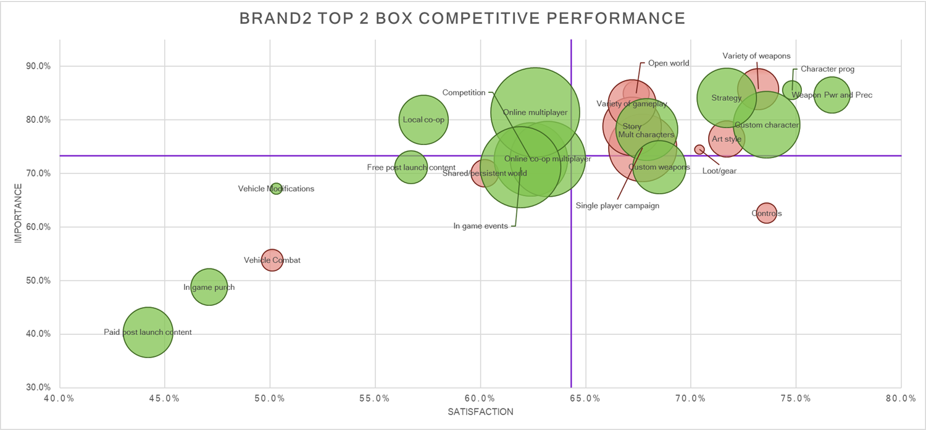
Competitive PI Analysis

Performance–Importance

Output
MaxDiff Analysis

Best–Worst Scaling

MaxDiff
Best for
Feature prioritization
Message testing
Brand attribute
Deliverables
TURF Analysis

Portfolio Optimization

Turf
Best for
Product line optimization
Media/channel mix
Feature bundling
Feature bundling
Includes
Driver Analysis

Relative Importance

Drivers
Best for
Customer satisfaction drivers
Purchase intent drivers
Brand performance analysis
Output
Next Best Change

Simulation

What makes it powerful
Goes beyond 'importance' → shows actual impact
Prioritizes changes that move the market
Simulates real decision outcomes
Perceptual Mapping

Correspondence Analysis

Includes
KANO Analysis

Feature Satisfaction Impact

Q-Sort Methodology

Structured Preference Capture

Competitive PI Analysis

Performance–Importance

Output

How These Methods Work Together

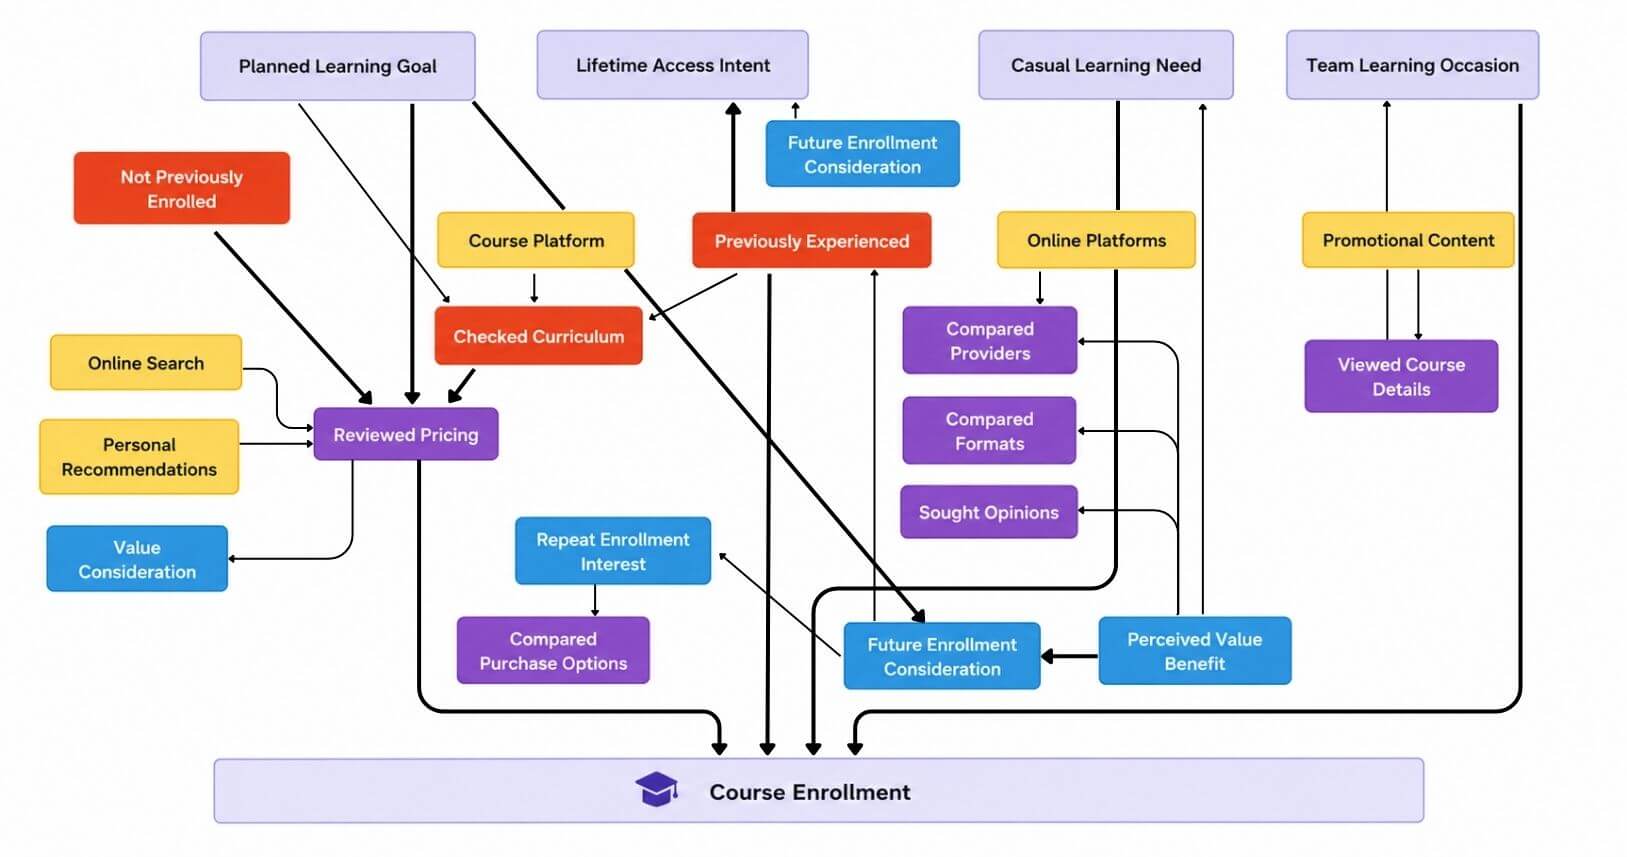
The real power comes from combining methods into a complete decision framework — not just isolated insights.

Anchored MaxDiff
What drives outcomes
TURF Analysis
How to best combine offers to maximize sales
Perceptual Mapping
Where you stand
Next Best Change
What to do next

Each method is designed to move beyond reporting and into decision-making.

We Don’t Just Identify What Matters
We Uncover How Decisions Are Actually Made

Course enrollment

Interactive Simulators for Real Decision-Making

Many of our methods include interactive simulators, allowing you to:

Test scenarios in real time
Explore subgroup differences
Optimize product or feature combinations
Turn insights into ongoing strategy tools

These are not static outputs — they’re working tools your clients can use.

Deliverables

What You Get

Every advanced analytics project includes:
Client-ready charts and visuals
Clear interpretation and recommendations
Optional interactive simulators
Fast turnaround (typically 2–5 days)
USE CASES

When to Use Advanced Analytics

Advanced analytics is ideal when:
You need clear prioritization (not flat ratings)
You want to optimize products, features, or messaging
You need to understand why outcomes happen
You want to move from insight to action

Interactive Simulators for Real Decision-Making

A comprehensive overview of our analytical methods, their applications, and expected delivery timelines.
METHOD
BEST USED FOR
TURNAROUND
ANCHORED MAXDIFF
Feature & message priority ranking
3–4 days
TURF + TURF TOOL SIMULATOR
Portfolio optimization & reach
3–4 days
RELATIVE IMPORTANCE / SHAPLEY
Driver importance with collinearity control
2–3 days
BIVARIATE CORRELATIONS
Fast driver screening
2–3 days
STEPWISE REGRESSION
Parsimonious driver model building
2–3 days
NEXT BEST CHANGE SIMULATOR
Actionable, respondent-level impact simulation
5–10 days
CORRESPONDENCE ANALYSIS / MOON PLOTS
Brand & product perceptual positioning
3–4 days
Q-SORT
Viewpoint typologies, priority structures
2–3 days
KANO ANALYSIS
Feature type classification (must-be vs. delighter)
2–3 days
COMPETITIVE PI CHARTS
Brand strength & threat prioritization
4–5 days

Turnaround times are estimates and may vary based on project scope and data complexity.

Pricing Information

Advanced analytics add-ons are priced based on the number of methods, subgroups, and whether a simulator is included. Most standalone analyses start under $1,500 and can be bundled for studies requiring multiple methods.

Individual Analysis

$500–$2,500

Advanced Analytics Bundle

$2,500–$6,000

Retainer / Ongoing

Custom

Book a 20-min scope call and we will give you a tailored estimate. Most advanced analytics are fast enough to fit into any existing study timeline.

Frequently Asked Questions

The real power comes from combining methods into a complete decision framework — not just isolated insights.
1. Can we combine multiple advanced analytics methods on one study?
Absolutely. Many projects benefit from combining methods — for example, MaxDiff to establish a priority hierarchy, then a Driver Map to understand causal paths, then a Competitive PI Chart to show where the brand stands. We scope these combinations regularly and know how to sequence the analyses so each builds on the last.
In most cases, we work from the raw survey data file (SPSS, Excel, or CSV). For some methods (like TURF or MaxDiff), we may need the specific question format built into the survey design in a particular way — reach out early in the survey design phase and we can review your questionnaire at no charge to ensure compatibility.
Yes. We provide proposal language, one-pagers, and example outputs to help you sell advanced analytics to clients who may not be familiar with these methods. Call or email and we’ll have materials to you same day.
Yes, and they complement each other well. MaxDiff tells you which features rank highest in priority; KANO tells you what kind of importance each feature has (is it a must-be, a linear performer, or a surprise delight?). Together they give clients a much richer feature strategy than either alone. The combined output is a strong, differentiated deliverable.

Both are based on the same correspondence analysis data. The standard perceptual map uses a traditional x-y scatter format where proximity indicates association. The Moon Plot presents brands at the center with attributes around the circumference — making it much more intuitive for non-technical audiences. We typically deliver both and let you choose which best serves the client’s presentation style.

It requires an underlying driver model as its input — either a Driver Map, stepwise regression, or relative importance analysis. If you already have driver values from a prior analysis, we can run Next Best Change off those. If not, we will build the driver model first. Typical combined turnaround is 4–6 business days.

Yes. The TURF Tool Simulator is a browser-based or Excel interactive tool that clients can use on their own after delivery. We train your team on how to demonstrate and interpret it, and it becomes a tangible artifact the client can use — which is one reason it generates strong client retention.

Same as all our work: Net-30, 50% on project start, 50% on delivery. For small standalone analyses under $1,500, we may invoice 100% on completion.