“We thought we were premium.” That short phrase alone has been brought up in multiple positioning discussions more than it really should have.
After a team has done a thorough job in creating a brand identity, a lot of effort is spent on packaging, messaging, and pricing, and then a perceptual mapping study reveals the brand is perceived as a budget competitor.
Perceptual mapping in market research closes this gap. Not the gap between you and your competitors, but the gap between your view of the brand and the actual perception of the customers.
The thing is, these rarely align, and a strategy based on the wrong one is sure to fail repeatedly.
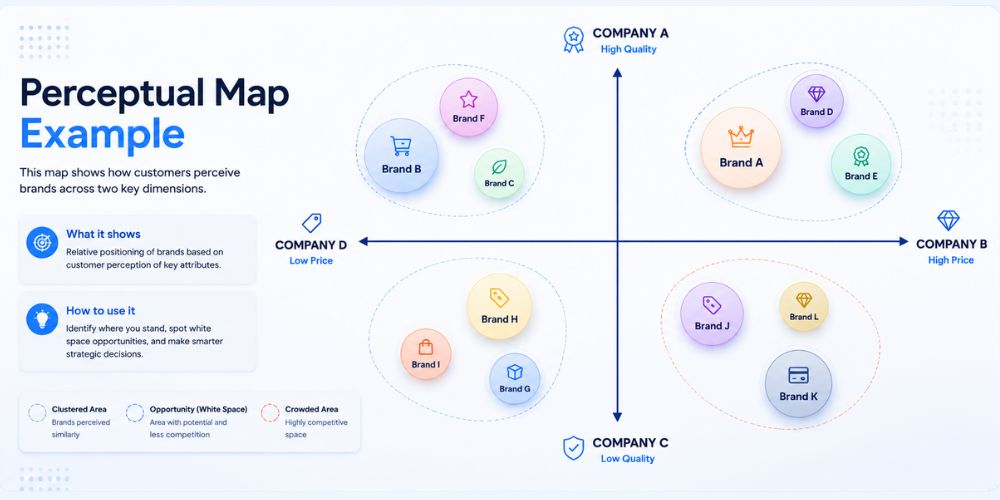
What a Perceptual Map Actually Shows You
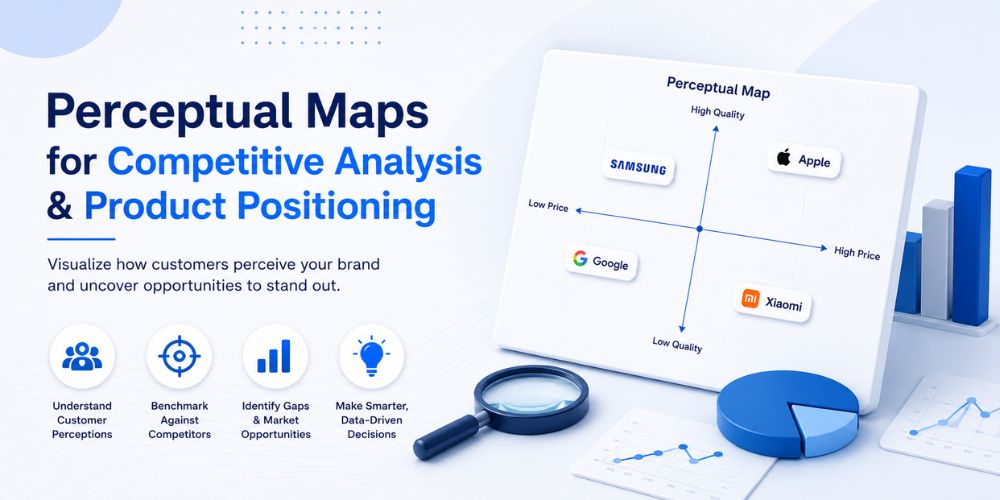
A perceptual map is a two-axis graph that shows how customers perceive your brand relative to others.
The axes are the features that are significant in your market (e.g., price versus quality, traditional versus very innovative, and accessible versus exclusive).
For example, in the smartphone market, brands often cluster around “high price–high performance” (like Apple and Samsung), while others compete in “low price–functional” space.
On the graph, each brand appears as a point based on overall customer evaluation.
This is not reality. It is an image of perception, and that’s what drives competitive strategy. In simple terms, it shows what customers believe, not what you intend.
Customers do not purchase based on your brand-provided guidelines. They buy based on the mental position they assign you compared to all other choices they have.
You typically use perceptual maps when launching a new brand, repositioning an existing one, or entering a competitive market where differentiation is unclear.
Step-by-Step: How to Use Perceptual Maps for Competitive Strategy
Step 1: Pick Attributes That Actually Drive Choice
That’s where everything begins. Your axes determine what the chart shows. If they are wrong, the map looks clean but is meaningless.
Features should represent what customers really consider when deciding on different brands in your industry.
That means getting customer feedback even before you start creating anything. Conduct interviews. Analyze survey data. Go through sales call records. Observe how customers talk about competitors in their reviews.
Your target is the factors that customers use to classify brands in their minds, rather than the factors that your marketing team cares about the most. Those two are often different.
Selecting attributes is only half the challenge. Understanding which attributes actually drive customer decisions can require more advanced driver analysis techniques.
Step 2: Collect Perception Data From the Right People
After finalizing the attributes, you should ask real customers how they would assess each brand in your competitive set regarding those attributes, often using methods like MaxDiff and Conjoint.
The thing you are measuring is perception, not brand awareness, brand preference, or brand satisfaction.
You’re measuring how customers place each brand on a scale. This matters for two reasons. First, your respondents must be those who have engaged with the category, not a random sample from the general population.
Opinions of someone who does not intend to buy from your category are unhelpful for data. Secondly, you must have a large enough sample for the results to be reliable.
From 50 responses, a map is merely a direction indicator at best; one based on 400 representative buyers is reliable enough for decision-making.
Step 3: Plot Every Competitor on the Map
First, calculate the average scores for each brand on each dimension and graph the result. Each brand corresponds to a point on the graph. Your brand is one of these points. This is where the real work starts.
Examine your position in relation to everyone else. It is common for teams to find out that the brands they thought were distant competitors actually sit close to each other.
Brands that teams thought were different often appear nearly identical.
One of the major revelations that led to the rewriting of entire marketing plans is finding out that the brand overlaps with competitors, which the company had never even considered as direct threats.
The map is not the expression of your intentions but of your customer’s perception.
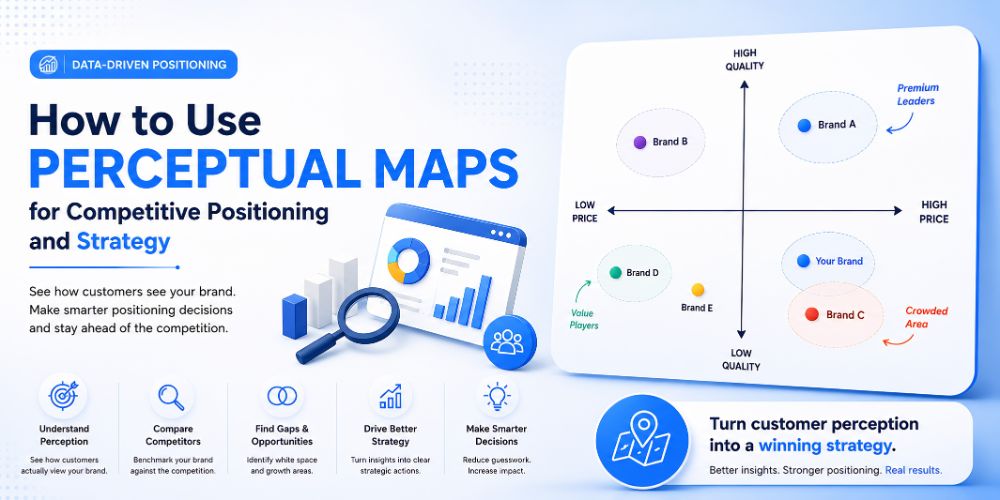
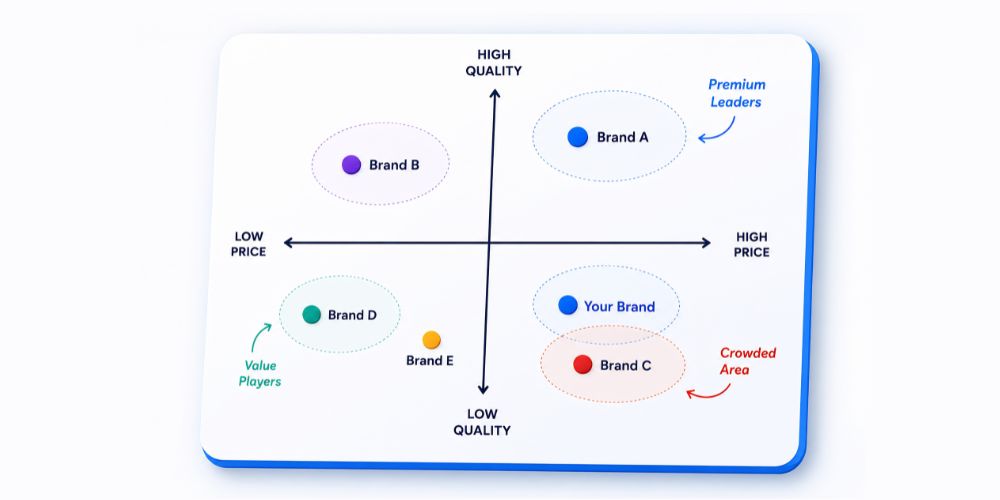
Step 4: Read the Clusters and the White Space
When you have plotted all the brands, there are two things you need to check: clusters and gaps.
Clusters show where brands compete for the same customer perception. If your brand is located in a cluster, then you have a problem with differentiation.
It does not matter how different the product actually is. If customers cannot see the difference, then the strategic advantage will not exist.
White space refers to unoccupied areas of perception that no brand currently owns. A gap in the map could be a potential opportunity, though it is not automatically a good one.
You have to ask yourself whether real customer demand is present in that space and whether your brand has the credibility to move there.
Customer segments often perceive competitors differently, making segmentation analysis a useful next step after perceptual mapping.
Step 5: Connect Every Insight to a Decision
Most teams lose focus right here. They create a great perceptual map, show it in a meeting, then forget about it. However, the map is not the real point. The point is the decision. When your brand is positioned next to a stronger competitor, what specific changes in messaging, product, or pricing will alter that perception?
For example, you might reposition your messaging from “affordable” to “reliable premium,” adjust pricing to better match perceived quality, or introduce a feature that competitors do not own.
If there is an area of white space, what would it take to capture it, and is that in line with where the business is going?
If your position is already very different, what steps are you taking to protect and strengthen it? Each finding from the map must lead to a decision, a test, or a strategic commitment. Otherwise, it’s just a costly graph.
How Moonplots Help Explain Brand Positioning
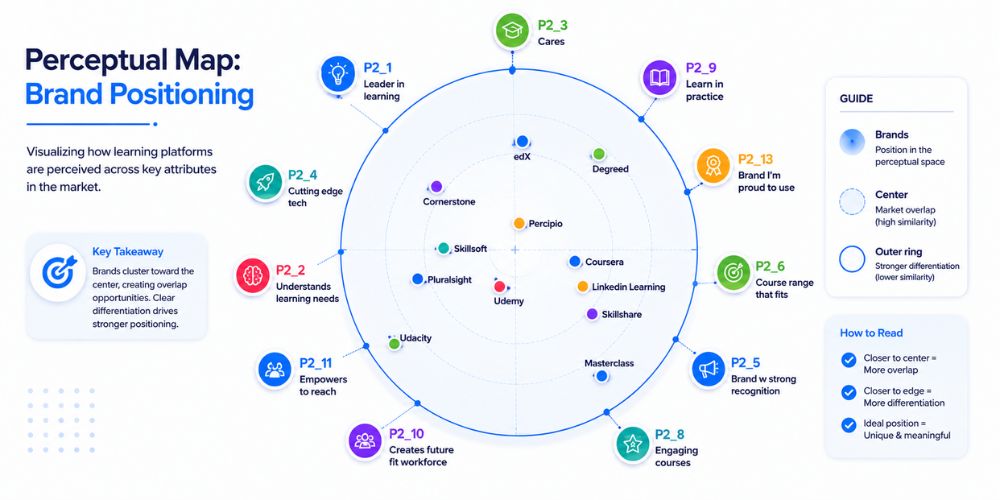
While perceptual maps illustrate where brands stand in relation to competitors, Moonplots help explain why consumers place them there.
Moonplots are another tool used in market research to understand brand positioning. They show how customers associate brands with different attributes and make it easier to understand brand positioning from the customer’s perspective. By separating brands from attributes, Moonplots can reveal competitive strengths, areas of overlap, and potential opportunities for differentiation.
One advantage of Moonplots is that they clearly show which characteristics differentiate brands. They can help you identify which competitors are strongly associated with attributes such as innovation, reliability, value, or premium quality, and also show you areas where no brand has yet established a strong position.
Moonplots also reduce visual clutter, making them easier for teams and stakeholders to understand than some traditional brand mapping techniques. This can make positioning discussions more productive and help businesses identify opportunities to strengthen differentiation.
Used alongside perceptual maps, Moonplots provide additional context about customer perceptions and the attributes that shape competitive positioning.
Three Mistakes That Undermine The Map
Using internal assumptions to pick attributes: If your team chose the axes without customer input, you measured what you care about, not what drives customer choice.
Letting your own team rate your brand: Internal bias contaminates perception data instantly. Always collect ratings from customers only.
Treating the map as permanent: Perception shifts. Competitors move. A map from eighteen months ago may no longer reflect how customers see the landscape today. Built with regular updates.
Position Your Brand on What Customers Actually Believe
Perceptual maps for competitive positioning work because they replace opinion with evidence. It is one of several advanced analytics methods used to uncover positioning opportunities and guide strategy.
They show your team, in a single view, exactly where your brand stands, where the competition clusters, and where the real strategic opportunities lie.
If you want to build that picture for your brand, The Analytics Team works with companies to design and interpret perceptual mapping studies that connect directly to positioning strategy, not just research reports that sit on a shelf. Book a 20-minute consultation call to get started.