Companies often know who their competitors are, but they don’t always know how customers compare them. You may believe your product offers better quality or value, but if customers see it differently, your positioning strategy may not deliver the results you expect.
This is where perceptual maps become valuable.
A perceptual map helps researchers and business teams visualize how customers perceive competing brands. Rather than relying on internal assumptions, it uses customer research to reveal how brands are positioned in customers’ minds, making it easier to identify competitive strengths, positioning gaps, and opportunities for differentiation.
Whether you’re launching a new product, repositioning an existing brand, or analyzing competitors, perceptual maps provide a simple way to understand customer perceptions and make more informed positioning, product, and competitive strategy decisions.
This guide explains not only what perceptual maps are, but also how experienced market research teams use them to evaluate competition, support product positioning, and make more informed business decisions.
What Is a Perceptual Map?
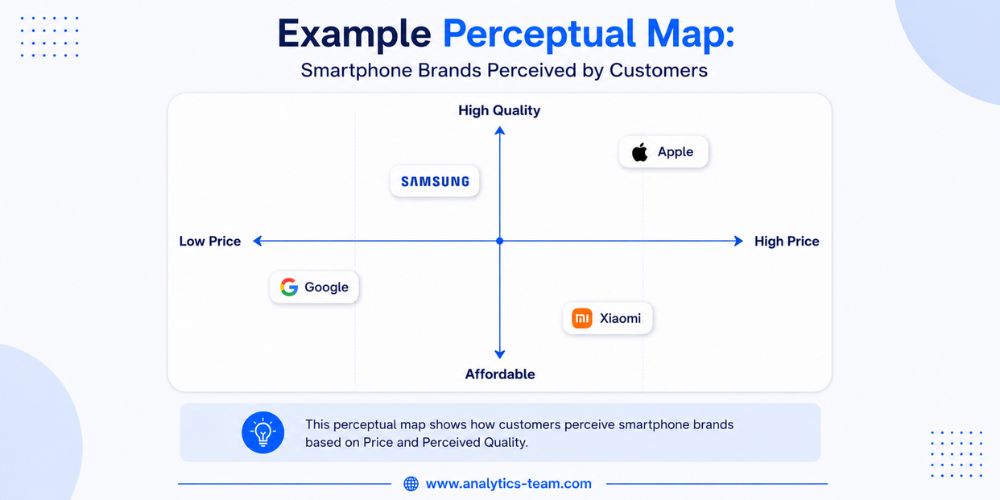
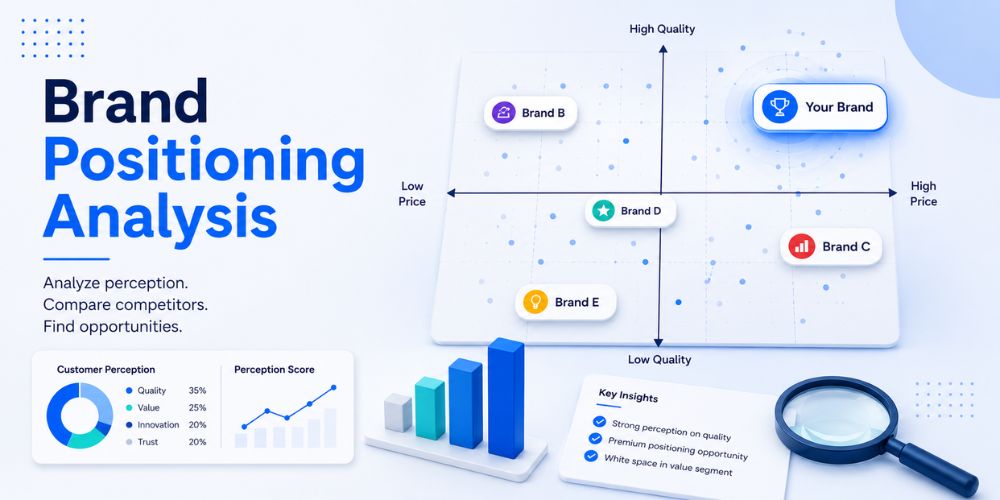
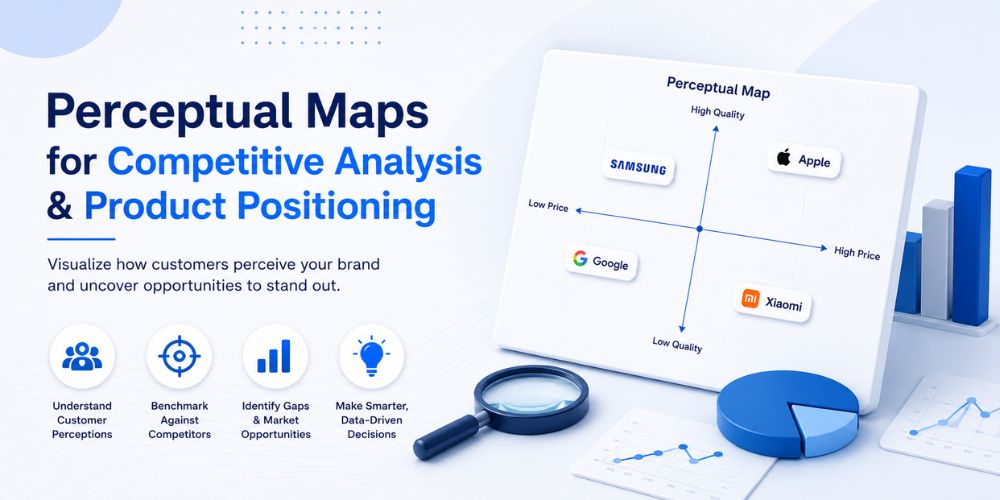
A perceptual map is a visual tool used in market research to show how customers perceive competing brands or products. It places brands on a two-dimensional map based on attributes that matter most to customers, such as price, quality, innovation, ease of use, reliability, or customer service.
Unlike internal business evaluations, perceptual maps reflect customer perception, not how a company views its own brand. This makes perceptual maps particularly valuable when market research teams need to understand competitive positioning from the customer’s perspective rather than relying on internal opinions.
For example, imagine several smartphone brands plotted on a graph with Price on one axis and Perceived Quality on the other. The map quickly reveals which brands are viewed as premium, budget-friendly, or somewhere in between. Experienced researchers pay particular attention to areas with little competitive overlap, but they don’t automatically assume these gaps represent opportunities. Instead, they investigate whether customers actually value that position before recommending a strategic move.
A perceptual map does more than show where brands sit in the market. It helps researchers understand how customers compare competing products, identify positioning gaps, and support strategic decisions with customer data rather than assumptions.
How Perceptual Maps Work
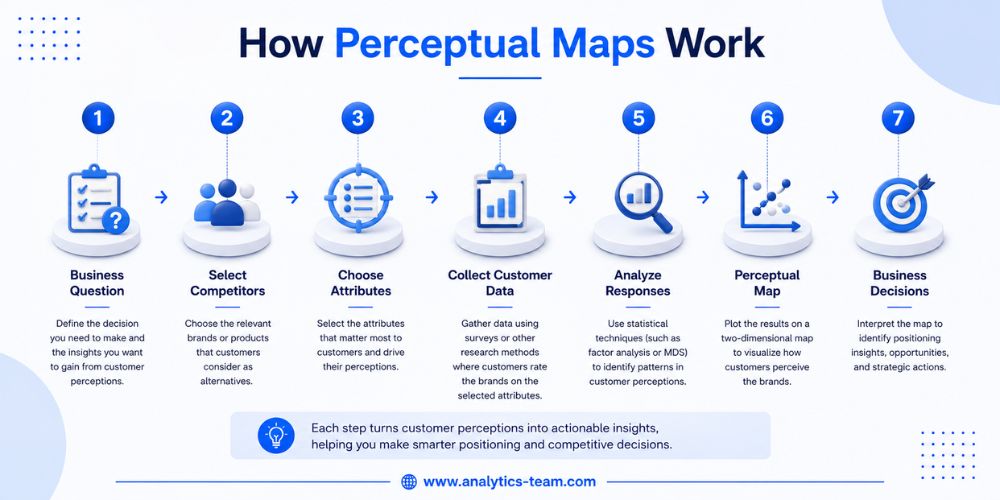
Perceptual maps are created using customer research rather than internal opinions. Every perceptual mapping study begins with a business decision rather than a visualization. Researchers first define the question they want to answer—for example, whether customers perceive their brand differently from competitors or whether opportunities exist to strengthen market positioning.
Customers evaluate each brand through surveys or other research methods. The responses are analyzed using statistical techniques to identify patterns in customer perception, which are then plotted on a visual map. Rather than simply showing where brands appear, the map reveals how customers compare competitors and where opportunities for differentiation may exist.
What Business Questions Can Perceptual Maps Help You Answer?
Market research teams commonly use perceptual maps to answer questions such as:
- How do customers perceive our brand compared to competitors?
- Which competitors are closest to our market position?
- Are we positioned as a premium, value, or innovative brand?
- Where are the biggest opportunities to differentiate?
- Are there gaps in the market that competitors haven’t filled?
- Does our intended brand positioning match customer perception?
By answering these questions, perceptual maps help businesses make more confident decisions about branding, product positioning, messaging, and competitive strategy.
Why Are Perceptual Maps Important in Market Research?
One challenge we often see is organizations believing they have a unique market position, while customer research shows buyers perceive very little difference between competing brands.
One of the biggest advantages of perceptual maps is that they replace internal assumptions with customer evidence. Research teams often discover that a brand’s intended positioning doesn’t match how customers actually perceive it, creating opportunities to refine messaging, product strategy, or competitive positioning.
They also improve communication across teams. Instead of reviewing large tables of survey data, stakeholders can quickly understand the competitive landscape through a single visual, making discussions and strategic decisions more focused and productive.
When Should You Use a Perceptual Map?
Perceptual maps are most valuable when you need to understand how customers view your brand compared to competitors. Instead of relying on internal assumptions, they provide a visual representation of customer perceptions, helping you identify positioning gaps and make more informed business decisions.
Perceptual maps are particularly valuable when you’re trying to answer questions such as:
- Compare your brand with competitors
- Evaluate customer perception before a product launch
- Reposition an existing product or service
- Identify gaps in the market
- Test whether your intended brand positioning matches customer perception
- Support competitive analysis with customer data
If your goal is to understand how customers perceive competing brands, a perceptual map is one of the most effective market research tools available.
What Data Is Needed to Build a Perceptual Map?
A perceptual map is only as reliable as the customer data used to build it. Instead of relying on internal opinions, researchers collect structured customer feedback that reflects how buyers compare competing brands.
Depending on the research objectives, experienced researchers typically collect data from sources such as:
- Customer surveys
- Brand rating scales
- Semantic differential scales (for example, Premium ↔ Budget or Traditional ↔ Innovative)
- Customer interviews
- Focus groups
- Existing market research data
The goal is to measure customer perception consistently across all competing brands so the resulting map accurately reflects the market. The quality of a perceptual map depends more on the quality of the customer data than on the visualization itself. Reliable research produces reliable positioning insights.
How to Create a Product Positioning Map
Creating a reliable product positioning map involves more than plotting brands on a graph. The quality of the map depends on choosing the right competitors, collecting meaningful customer data, and interpreting the results correctly. Most perceptual mapping studies follow the steps below.
1. Define Your Research Objective
Start by defining the business question you want to answer. For example, are you comparing competitors, evaluating a new product, testing a repositioning strategy, or identifying gaps in the market? A clear research objective helps determine which brands, attributes, and customers should be included in the study.
2. Identify Your Competitors
Start by selecting the brands or products you want to compare. These should be the competitors your target customers are most likely to consider when making a purchase.
Selecting the right competitors is critical. Including brands that customers don’t genuinely consider as alternatives can distort the results and reduce the value of the analysis.
3. Choose the Right Attributes
Next, decide which attributes customers use to compare products.
One of the most common mistakes is choosing attributes that matter to the business rather than the customer. The selected attributes should reflect how customers actually evaluate competing products when making purchasing decisions.
Common attributes include:
- Price
- Quality
- Innovation
- Ease of use
- Reliability
- Convenience
- Performance
- Sustainability
Choose attributes that are meaningful, measurable, and relevant to your research objectives.
4. Collect Customer Feedback
Gather customer perceptions through surveys, interviews, focus groups, or other market research methods.
Rather than asking customers where they think brands belong on a map, ask questions that measure how they perceive each brand across the selected attributes.
This approach produces more objective and reliable positioning data.
5. Analyze the Customer Data
Once the research is complete, the responses are analyzed to identify patterns in customer perception. Although the statistical analysis happens behind the scenes, it plays a critical role in ensuring that the distance between brands reflects genuine customer perception rather than subjective interpretation.
6. Plot the Results
Once the research is complete, convert the data into a two-dimensional perceptual map.
Each axis represents an attribute—for example:
- Price ↔ Quality
- Traditional ↔ Innovative
- Basic ↔ Premium
Each brand is then positioned according to how customers perceive it.
The visualization itself isn’t the final outcome. It provides the foundation for interpreting customer perception and supporting strategic decisions.
7. Interpret the Insights
Creating the map is only the beginning.
The real value comes from understanding what the results mean.
Rather than immediately acting on the visualization, experienced researchers ask questions such as:
- Which brands are positioned closest together?
- Are there underserved areas of the market?
- Does our intended positioning match customer perception?
- Which competitors are viewed as premium?
- Where can we differentiate?
These insights help shape product strategy, messaging, pricing, and future positioning decisions.
How to Read a Perceptual Map
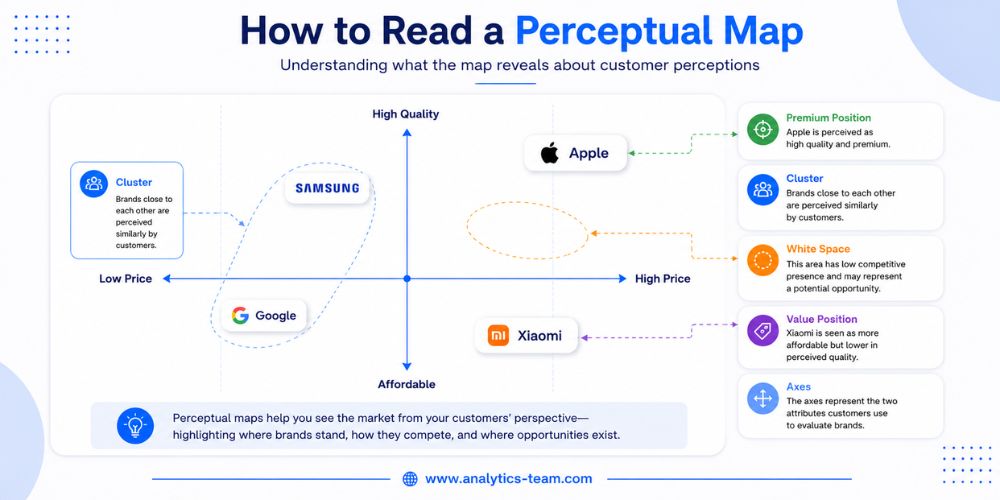
Creating a perceptual map is only the first step. The real value comes from interpreting what the map reveals about customer perception and competitive positioning. Rather than looking only at where brands appear, researchers focus on the relationships between brands and the opportunities those relationships highlight.
Distance Between Brands
A common misconception is that brands positioned close together compete only on price. In reality, close positioning simply indicates that customers perceive them similarly based on the selected attributes. Researchers then investigate whether stronger differentiation is needed.
Brand Clusters
When several brands appear grouped together, they form a competitive cluster. This suggests customers see these brands as close substitutes. Understanding these clusters helps businesses identify their closest competitors and determine whether stronger differentiation is needed.
Empty Spaces
One of the first things people notice on a perceptual map is an empty area with few or no competitors. While these gaps may represent opportunities, they should not automatically be treated as attractive market positions. Experienced researchers first validate whether customers actually value that position before recommending a new product or repositioning strategy.
Understanding the Axes
The meaning of a perceptual map depends on the attributes chosen for each axis. A map comparing Price and Perceived Quality answers different questions than one comparing Innovation and Ease of Use. Selecting attributes that reflect how customers make purchasing decisions is essential for producing meaningful insights.
Turning Insights into Business Decisions
The purpose of a perceptual map isn’t simply to visualize the market—it’s to support better decisions. Researchers use the findings to refine brand positioning, identify competitive gaps, evaluate repositioning opportunities, and guide future product and marketing strategies.
How Perceptual Maps Support Competitive Analysis
One question market research teams often ask is whether customers see competitors the same way the business does. Perceptual maps provide an evidence-based answer by visualizing customer perception rather than relying on internal assumptions.This helps organizations identify competitive threats, positioning gaps, and opportunities that may not be obvious from sales data or market share alone.
Instead of simply identifying who your competitors are, perceptual maps explain how customers compare those competitors and where meaningful opportunities for differentiation exist.
Discover Market Opportunities
Perceptual maps often reveal areas of the market where customer needs are not being fully addressed.
However, experienced researchers rarely recommend acting on a gap without validating that customers genuinely value the opportunity.
An empty space on a perceptual map often attracts attention, but it doesn’t automatically represent a business opportunity. Researchers first determine whether customers actually value that position before recommending a new product or repositioning strategy.
Understand How Customers Compare Brands
Brands that appear close together on a perceptual map are often viewed similarly by customers.
Recognizing these clusters helps businesses understand which competitors are fighting for the same audience and where differentiation is needed.
Validate Your Brand Position
Many organizations have a desired market position, but customer perception doesn’t always match that intention.
Perceptual maps help verify whether your current positioning aligns with how customers actually see your brand.
Improve Product Positioning
Whether launching a new product or updating an existing one, perceptual maps help businesses decide how to position their offering relative to competitors.
Rather than relying on intuition, product teams can use customer perception data to support positioning decisions with greater confidence.
Common Types of Product Positioning Maps
The attributes used on a perceptual map depend on the research objectives, but some combinations are used more frequently because they reflect how customers compare competing products and brands.
Price vs Quality
This is one of the most widely used perceptual maps because customers often compare products based on value for money. It helps businesses understand whether their brand is perceived as premium, budget-friendly, or somewhere in between, making it useful for pricing decisions and competitive positioning.
Traditional vs Innovative
This map shows whether customers view a brand as an established, conventional choice or as an innovative market leader. It is commonly used when businesses launch new products, reposition existing brands, or want to understand how they compare with more disruptive competitors.
Premium vs Value
Although similar to Price vs Quality, this map focuses on perceived value rather than cost alone. Researchers use it to determine whether customers believe a product justifies its price, helping organizations refine pricing strategies, brand messaging, and product positioning.
Ease of Use vs Functionality
This perceptual map is widely used in technology and software markets where customers often balance simplicity with advanced capabilities. It helps businesses understand whether their products are viewed as user-friendly, feature-rich, or a combination of both, supporting product development and user experience decisions.
Sustainability vs Performance
As environmental concerns continue to influence purchasing decisions, many organizations evaluate whether customers see their products as both sustainable and effective. This map helps identify opportunities to strengthen brand positioning while balancing environmental responsibility with product performance.
When Are Perceptual Maps the Right Choice?
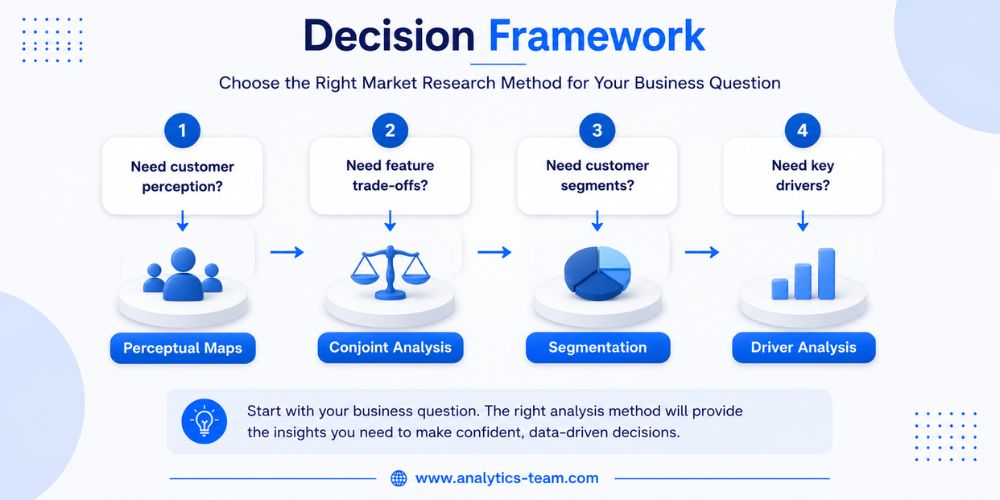
Perceptual maps are valuable for understanding how customers perceive brands and products, but they aren’t the right research method for every business question. Choosing the appropriate methodology helps ensure your research delivers meaningful and actionable insights.
| Business Objective | Recommended Method |
| Visualize brand perception and market position | Perceptual Maps |
| Measure feature trade-offs and willingness to pay | Conjoint Analysis |
| Identify customer segments | Segmentation Analysis |
| Understand what drives customer satisfaction or preference | Driver Analysis |
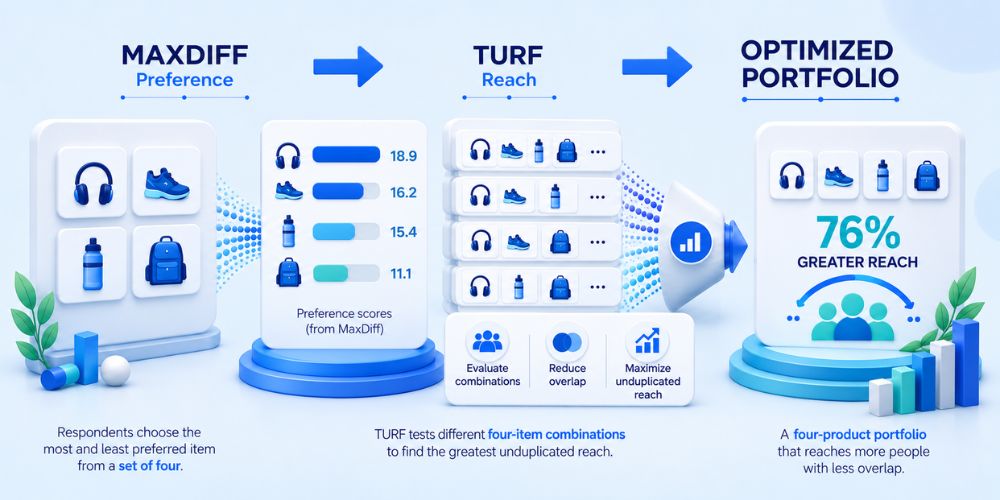
| Optimize product portfolios | TURF Analysis |
In many projects, these methods work best together. For example, a market research team might use perceptual maps to understand brand perception, conjoint analysis to optimize product features and pricing, and driver analysis to identify the factors that influence customer preference.
Perceptual Maps vs. Conjoint Analysis
Although both methods support strategic decision-making, they answer different business questions.
| Perceptual Maps | Conjoint Analysis |
| Shows how customers perceive brands | Measures how customers make purchasing decisions |
| Focuses on brand positioning | Focuses on feature and price trade-offs |
| Supports competitive analysis | Supports product and pricing optimization |
| Identifies positioning gaps | Estimates willingness to pay |
| Visualizes market perception | Predicts customer preferences |
Perceptual maps help answer “How are we perceived?”
Conjoint analysis answers “Which product or pricing strategy will customers choose?”
Many organizations use both methods together to develop stronger positioning and product strategies.
What Perceptual Maps Cannot Tell You
Although perceptual maps are valuable for understanding customer perception, they have limitations. They do not measure willingness to pay, predict purchase behavior, estimate demand, or identify which features customers value most.
To answer those questions, market research teams often combine perceptual maps with methodologies such as conjoint analysis, driver analysis, or segmentation analysis, depending on the research objectives.
These methodologies are complementary rather than competing, and experienced market research teams often combine them to answer broader strategic questions.
Common Mistakes When Creating Perceptual Maps
Most perceptual mapping studies don’t fail because of the visualization—they fail because the underlying customer research doesn’t accurately reflect how buyers compare competing brands. This is one of the most common reasons perceptual mapping studies produce misleading insights.
Some of the most common mistakes include:
Choosing the Wrong Attributes
A perceptual map should reflect the attributes customers actually use when comparing products—not the attributes a business believes are important.
Selecting irrelevant attributes can produce a map that looks useful but provides little strategic value.
Relying on Internal Assumptions
One of the biggest mistakes is building a perceptual map based on internal opinions instead of customer research.
Perceptual maps should represent customer perception, not how a company wants to be perceived.
Comparing the Wrong Competitors
Including brands that target different customer segments or compete in different markets can distort the results.
Always compare brands that customers genuinely consider as alternatives.
Misinterpreting the Distance Between Brands
Brands positioned close together on a perceptual map are generally perceived as similar, while brands farther apart are viewed as more distinct.
However, the map should always be interpreted alongside the underlying research data rather than in isolation.
Treating Perceptual Maps as the Final Answer
Perceptual maps show how customers perceive the market, but they don’t explain why those perceptions exist or which changes will improve business outcomes.
To answer those questions, researchers often combine perceptual maps with methodologies such as conjoint analysis, driver analysis, or segmentation analysis.
How The Analytics Team Helps Market Research Agencies
Perceptual maps are most valuable when they’re interpreted alongside other advanced analytics methods. The Analytics Team works with market research agencies and insights teams to design, analyze, and interpret perceptual mapping studies, interpret customer perception data, and combine those insights with conjoint analysis, driver analysis, and segmentation. This integrated approach helps organizations move beyond understanding where brands are positioned to making better product, pricing, and competitive strategy decisions.
Make Better Competitive Positioning Decisions with Perceptual Maps
Successful positioning starts with understanding how customers see your brand—not how you see it.
Perceptual maps provide a clear visual view of the competitive landscape, helping businesses identify positioning gaps, understand competitor relationships, and uncover opportunities for differentiation.
When combined with other market research methods, they become even more valuable, supporting better product positioning, stronger messaging, and more confident strategic decisions.
If your team is planning a positioning study or needs expert support interpreting perceptual maps, The Analytics Team provides specialist analytics expertise to help market research agencies design robust perceptual mapping studies, interpret complex customer perception data, and translate those insights into confident business decisions.
Frequently Asked Questions
What is a perceptual map in market research?
A perceptual map is a visual representation of how customers perceive competing brands or products based on attributes such as price, quality, innovation, or reliability. It helps businesses understand their competitive position and identify opportunities for differentiation.
What is a product positioning map?
A product positioning map is a type of perceptual map that compares products based on the attributes that matter most to customers. It helps businesses understand how their products are positioned relative to competitors.
How are perceptual maps used for competitive analysis?
Perceptual maps help businesses compare competitor brands, identify positioning gaps, understand customer perceptions, and discover opportunities to differentiate their products or services.
What is the difference between a perceptual map and a positioning map?
The terms are often used interchangeably. A perceptual map emphasizes customer perception, while a positioning map generally focuses on how products or brands are positioned relative to competitors. In practice, both are commonly used to support competitive analysis and product strategy.
How are perceptual maps different from conjoint analysis?
Perceptual maps show how customers perceive competing brands, while conjoint analysis measures how customers make trade-offs between product features, pricing, and other attributes. The two methods answer different business questions and are often used together in market research.