No synthetic respondents. A frontier AI model reads between the lines of survey data you control. It connects the dots, extends existing insights, and identifies new ones worth exploring. Every answer is validated and verified against the actual data.
The single biggest conversation in market research right now is AI. Much of what is on offer takes it in the wrong direction: manufactured respondents and estimates of opinions that no study ever measured.
We built Chat with your Data on a different principle. The AI works with a study you have already run with real people, and every claim it makes is checked against what those respondents actually answered.
This post shows one exchange where that approach earned its keep. It also publishes two of our own defects, because a principle is cheap without evidence.
What Chat with your Data Is
Chat with your Data lets you have conversations with your survey data.
You can ask a question of a whole segment in plain English, talk one-on-one with individual respondents built from real survey records, or run a topic-driven group discussion across segments.
Answers come back in the respondents’ own terms, grounded in what they actually said. Every structured answer also lists the survey question IDs it rests on.
The goal is simple: get more out of every study you run.
That means reading between the lines of a study you have already fielded, extending the insights, and ending with a list of what is most worth confirming with real people.
Two Answers No One Had Looked at Together
Here is one of those conversations — a single exchange from our testing record on the Solvane demo study, a real segmentation over real study artefacts with fictional brand names.
A researcher put one question to one segment: the 337 respondents this study calls its Always-On Multitaskers.
Meridian is the right opening. It is the name 41% of that segment actually gave, and the answer states the record before reading anything into it.
But one recorded draw of this exchange went further than the crosstab.
Reading across everything else those same 337 respondents had answered, it connected the television question to a second question from the same study — about streaming devices — and identified something about the brand that neither question shows by itself.
That claim was then checked, not just asserted.
In the product, every structured segment answer can be evaluated. A second model automatically reads the answer against the actual survey data and rates it. The answer appears first, and the verdict follows a few seconds later.
The evaluation of that draw returned a SOUND verdict and rated the answer 4 out of 5 for depth. It explained why:
“That the same brand (Solvane) can be simultaneously weak/flat as a TV choice and the clear streaming-device leader within the same people… a genuinely cross-question insight a single crosstab wouldn’t surface.”
On the evaluation’s own scale, a 4 means the answer connects two or more separate survey questions into an insight neither shows by itself. An answer that only restates the survey tables scores a 1 or a 2.
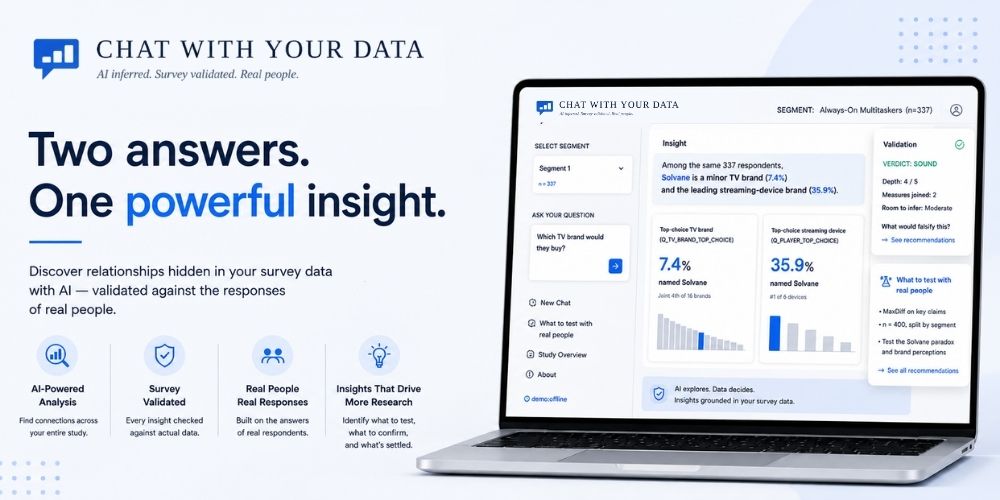
Here are the two data points it connected, side by side, as the study recorded them.
Solvane is a minor TV brand and the
leading streaming-device brand — at
the same time, in the same data.
The TV question alone says Solvane is weak. The streaming question alone says it is strong.
Only the two together reveal that the same respondents passed over Solvane for the television and chose it for the streaming device.
That is not a tracking number. It is a question about what the brand stands for, and about which shelf the next launch belongs on.
The AI connected the two answers itself; no one had ever asked for that crosstab.
Those two answers came from two questions among the 628 substantive variables the study measured.
No one had ever analyzed them together, and no one was negligent. 628 substantive variables make 196,878 possible pairs, and a banner plan covers only the handful of comparisons anyone has time to specify.
That is the gain: reading between the lines of survey data and findings, and extending the insights. It adds a new level of value to a study that was already finished and paid for before anybody thought to ask the follow-up.
It can reach that far for one reason, and it is the argument the industry is currently having.
A frontier AI model brings the reach. The survey data decides what holds.
The model reads across everything those 337 respondents answered — every scale item, every open end, every trade-off. It is not limited to the handful of questions anyone had time to analyze together.
The survey data is the other half, and it is not decoration. Any percentage the AI quotes must be that segment’s own, and every claim is checked against the actual survey record.
The model proposes the insight; the data decides whether it survives.
None of this competes with the research a consultancy or an insights team already does, and it is not meant to.
The study is one you have already run with real respondents. The analysis it deepens is the one your team already delivered.
The end point of every session is a list of high-value new insights — extrapolated first, then validated — worth confirming in next-step research with real people.
One thing about that finding, though.
The TV brand question it rests on very nearly never reached the model at all. What the AI was reading in its place is the reason for the rest of this post.
The Question That Never Reached the Model
“Good.”
That is what four of our five segment voices were reasoning from when a colleague asked which television brand they would buy.
Not “Meridian”, the name 41% of that segment gave.
“Good” is the literal value of Q_TV_BRAND_TOP_CHOICE_OE_RIDResult: 199 Good, 8 Bad, 2 Warn across 209 records.
It is not a survey question. It is the panel provider’s verdict on whether a respondent looks like a real human being.
Our personas read it as a consumer opinion and built a story about brand indifference on top of it.
The brand question was in the study. It never reached the model.
Each segment had 708–716 answer distributions available. Exactly 52 were rendered into the prompt.
The rest ended at … plus 668 further questions, and the brand question sat in that remainder for all five segments.
That is not a bug in the ordinary sense.
The summary each segment voice starts from ranks the study’s questions by how much that segment’s answers differ from everyone else’s. Difference is what makes a segment worth speaking as.
The TV brand question does not differentiate the segments — Cramér’s V = 0.101, p = 0.345 — so it never made the cut.
But a question the segments agree on can still be exactly the question an analyst needs answered.
Nothing in the instructions was wrong. The AI worked from the percentages it was given.
The rule that selects what the model sees rewards difference. The questions researchers ask are often about what does not differ.
The fix was not prompt wording.
The full-sample tables now ship with the study, so the base per segment moved from n=50 to the real 337 / 369 / 498 / 331 / 230, with a significance test beside every figure.
A question-directed lookup now finds the answer distributions a question is actually about and places them in that turn’s message.
The platform’s own bookkeeping — fraud verdicts, confidence scores, whitelist matches — is also stripped at the single entry point every caller comes through: 1,473 such answers dropped across 250 records.
Cost, measured rather than estimated: the system block went from about 4,800 tokens to about 5,900, cached provider-side after the first turn, plus about 470 new tokens each turn — roughly 6,400 a turn in total.
One correction went against us, and we published that too.
An earlier draft claimed the metadata was outranking the real question in retrieval.
Measured, it was not.
Why We Are Publishing a Defect
Because the market has good reason to assume we are hiding one.
In the User Interviews State of Synthetic Users study, fielded 11–22 May 2026 among 150 research professionals, only 8% said they actively use AI to simulate research participants.
Forty-seven per cent called themselves sceptical, 17% opposed, and 89% worried about the quality and accuracy of the insights (User Interviews).
Set that against the offer.
Qualtrics Edge sells “synthetic responses tailored to specific demographics… in a matter of minutes”, on a launch promise to “reduce survey costs by up to 70%” (Qualtrics, March 2025).
The published record is unkind to that.
Bisbee and colleagues found simulated respondents track ANES benchmarks while the variance of the estimates runs “far too low”.
Kim and Lee, predicting answers nobody was ever asked, report a model that can “predict only about 12% of true survey responses”.
One 2024 startup’s simulated electorate matched real surveys on mean absolute error and still called the wrong candidate in five of ten races (Survey 160).
Or Escalent‘s Greg Mishkin:
“300 synthetically boosted isn’t the same thing as 300 more humans.”
Every one of those findings indicts the same act: estimating opinion a study never measured.
The Solvane insight above is not that, and the difference is mechanical.
A segment voice is governed by that segment’s own answer distributions, computed in Python over every member of the segment rather than the ten most typical.
Build a voice from ten typical respondents and you are simulating ten people while calling it a segment of four hundred.
Missing from the summary does not mean missing from the study.
So each segment voice now starts from 24 ranked distinctive measures and 40 further questions, and every other question in the study stays retrievable by name.
On each turn, the six answer distributions most relevant to the question — match_k = 6 — are fetched fresh, with the arithmetic already done:
5 of 10 said “Meridian”, about 4.1 expected
The model never has to count respondents itself.
The failure mode here was never an invented population.
It was the model reasoning from the wrong answers — and the whole design is about putting the right answers in front of it.
Why You Can Rely on It
Validated. Verified. Audited against the actual data.
Those are three separate checks, and they run in that order.
First, the labels.
Every structured segment answer is labelled anchored, extrapolated or imagined, and lists the survey question IDs it is based on.
IDs that do not resolve to real questions are stripped. An answer claiming anchored with nothing verifiable behind it is downgraded to extrapolated by the application, not by the model.
Then the audit — the evaluation this post has been quoting.
A second, separate model reads the answer against the survey data it came from and returns ten fields in a fixed order, enforced by unit tests, because the order is the method.
Room to infer records how much inference the question allows. It is decided from the question alone, before a word of the answer is read.
So a low depth score on a purely factual question is a correct result, not a failure.
Measures joined counts how many separate survey questions the answer draws on. It is a count, not a judgement, recorded before the score.
That is why the 4 above is a measurement of depth, not an impression of it.
And the verdict — sound, overreach or contradicted — is a single word, so the severity of a problem is never buried in prose.
The audit does not hold the answer back.
It runs in the background on each turn. The answer appears first, and the verdict follows a few seconds later.
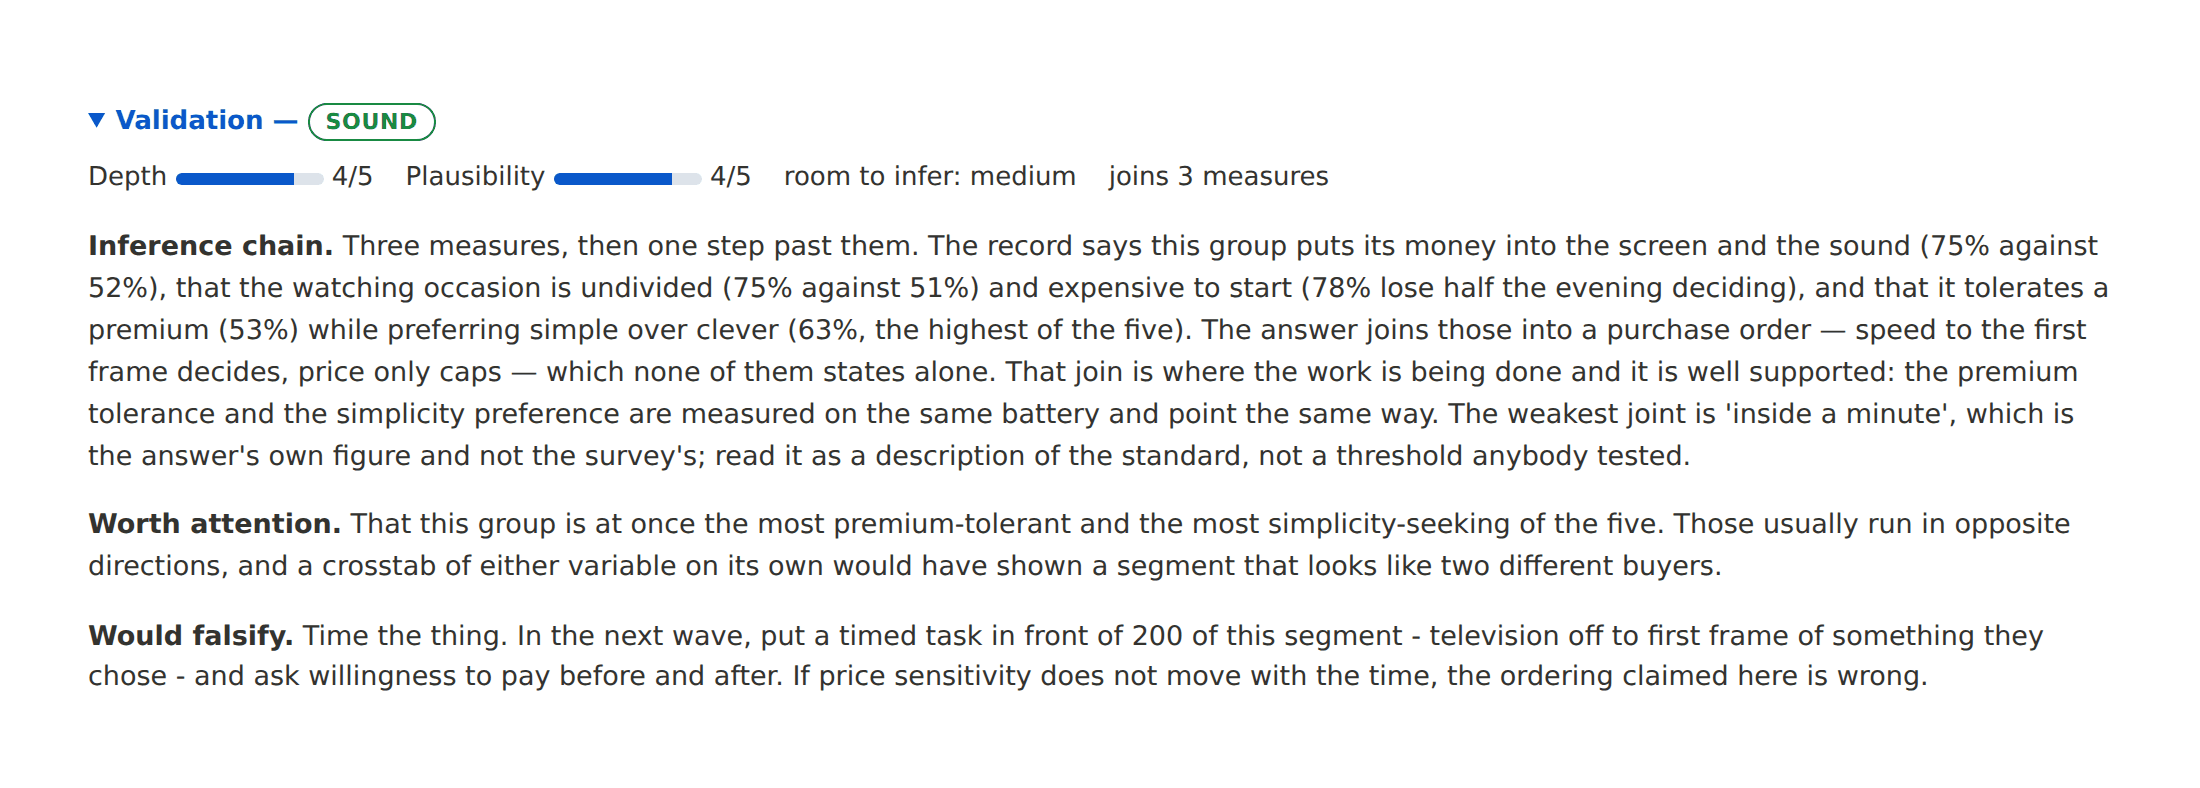
The screenshot below shows one of these evaluation blocks as it renders in the product — under a different answer, because every audited answer gets the same block.
It shows the one-word verdict, the depth and plausibility ratings, the room the question left for inference, the count of measures joined, and the question that would falsify the claim.
The evaluation model is a separate model role, not a fact-checker against ground truth.
Most of what a segment voice says has no single true answer to look up. That is why you asked the question instead of reading a crosstab.
The evaluation can also fail to run.
When that happens, the block renders in the same red as a contradiction:
“Not validated… do not quote it as checked.”
The flag is recorded in the database rather than only on screen, and the credit is refunded.
The Second Defect, Which Was in the Grader
The evaluation model once returned CONTRADICTED because “2 of 3 individuals actually chose Orchard Box”.
That was not merely unhelpful.
It was backwards.
Here is why.
Meridian was the top-choice TV brand of 41% of that segment, so among three typical members you would expect 1.2 to name it.
Two did.
P(2 or more of 3) is 37% — nothing unusual.
A segment is a group of respondents clustered on a subset of measures. On everything else, they vary.
Across 628 substantive variables, that shape of “surprise” turns up about 43 times per segment by chance alone.
Treating it as a contradiction would therefore flag nearly every question in the study.
The root cause was not a bad threshold.
On a segment turn, the evaluation model was handed the literal string “(segment persona — no single record)” while its own instructions opened:
“You have one real person’s complete survey record.”
Told it had a record and given none, it applied an individual standard to a claim about several hundred people.
The fix was statistics, not wording.
Ten typical members instead of three. The arithmetic was done in Python and handed to both the segment voice and the evaluation model as a ready tally.
We also added a segment-specific evaluation prompt with a section headed “Within-group variation is not a finding”.
On the case that triggered the flag, ten members give 5 of 10 against an expected 4.1.
Ordinary.
The loop now closes end to end.
A segment voice’s reasoning reads:
“5 of 10 picked Meridian (close to the 41% expected)… no internal_disagreement flag needed”
and the evaluation endorses it as:
“good practice”.
Across four later runs, its objections shifted to the quality of the inference — which is the argument you want to be having.
The screenshot below shows an answer card from a different segment, answering the same streaming-device question as the two-answers exchange earlier in this post.
That segment has its own base of 498 respondents rather than Segment 1’s 337, which is why Solvane takes 38% here against 35.9% earlier.
Different segment, different answers — and the card prints its own base size.
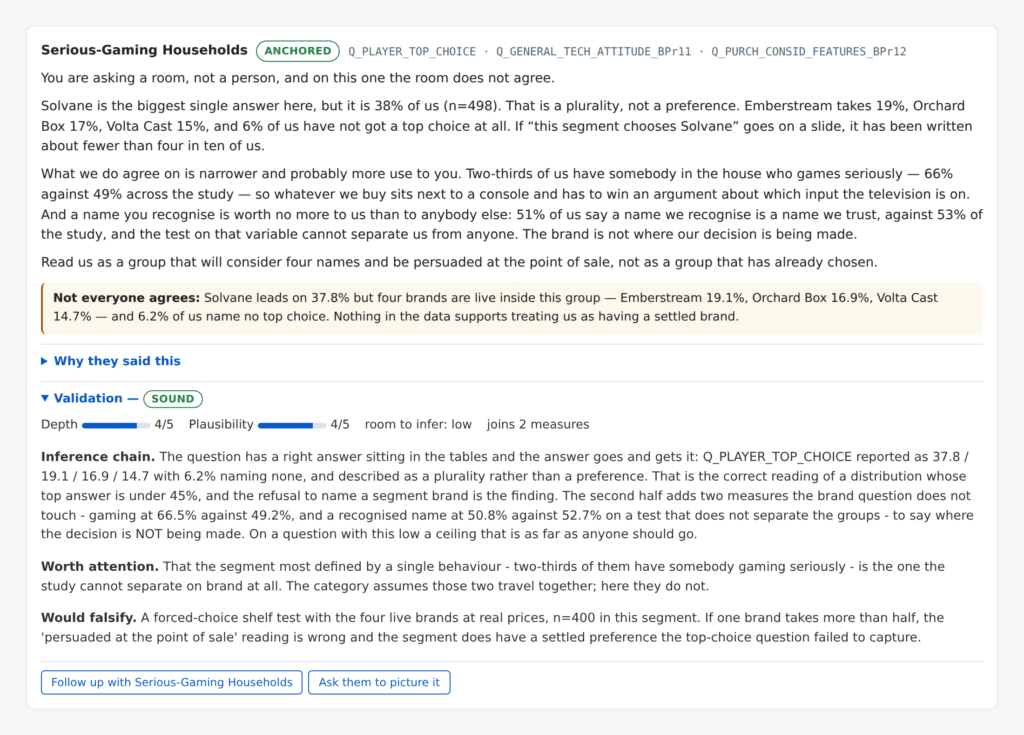
Any top answer under 70% prints with a split warning, and the evaluation model is held to the same standard.
What to Test With Real People
Every audited answer ends with the same field:
what would falsify this claim.
Those questions are the bridge back to real research.
One button gathers all of them into a card headed What to test with real people.
The hypotheses are stated plainly enough that a real result could contradict them.
Each one comes with a suggested method and an instrument specific enough to cost:
“a MaxDiff on the six claims, n=400, split by segment”
It also states the outcome that would prove the claim wrong.
The screenshot below shows the card in full.
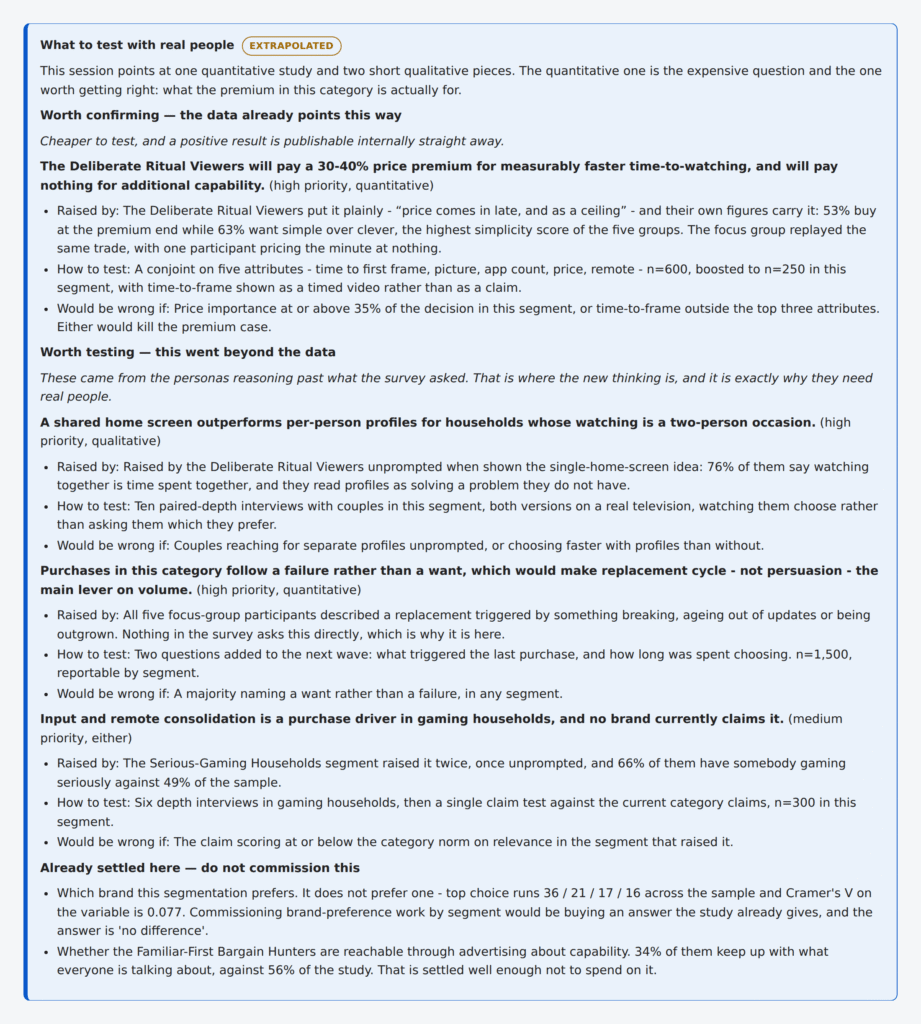
The card is grouped by how much support an insight already has:
Worth confirming versus Worth testing.
These are not priority ratings.
Priority says how much an insight matters. These groupings say how much you already know.
And at the end, the section nobody else writes for you:
Already settled here — do not commission this.
What It Does Not Do
The product says it first, on its own About tab:
“It is not new fieldwork, and nothing here is a substitute for asking real people a question you have not asked them yet.”
Not every answer is checked.
Audited: structured segment answers on direct questions, and focus-group turns if you tick the box, which is off by default.
Not audited: free chat, generated images and their briefs, the comparison card, the moderator turn and the five insight cards.
Free chat carries a permanent notice:
“Nothing in this mode is validated”
There is no toggle. A checkbox would imply there was something to validate.
Unvalidated quotes are marked in the Word and PowerPoint exports at three independent layers, so the distinction survives even when the writer forgets.
The percentages on screen will not match your own tables exactly.
Where the full tables ship, they are full-sample. Otherwise, the app recomputes from the sampled records.
Meridian — the 41% this post has been rounding to throughout — is 38.4% of the 250 sampled records against 41.5% in the full table.
That gap is the sampling, not an error.
A human still decides everything that matters:
- who is asked
- who answers
- what the segments are called
- what the write-up says
- what gets commissioned
And whether the audit is right, because the evaluation model can be wrong, as it was above.
Authentication is deliberately interim: the first thing to replace in production.
See Chat with your Data on Your Own Study
Bring one segmentation you have already fielded and we will spend thirty minutes on it live.
Your segments in the picker. Your questions in the box.
For every structured answer that comes back, you will see the survey question IDs it rests on, the depth rating it was given, and the verdict a second model reached.
Sources
- User Interviews, State of Synthetic Users, fielded 11–22 May 2026, n=150 — userinterviews.com
- Qualtrics Edge, and the March 2025 launch release — qualtrics.com/edge, newsroom
- Survey 160, The Limits of Simulation in Public Opinion Research (Bisbee et al.; Kim and Lee) — survey160.com
- Escalent, Synthetic Data in Market Research: Practical Guidance Without the Hype, March 2026 — escalent.co
- Market Research Society, Synthetic Respondents in Market Research: Risk or Reward? — mrs.org.uk
Screenshots and figures are from the running application on the Solvane Connected Entertainment Segmentation — a demo engagement over real study artefacts.
Segment bases, lifts and every percentage quoted are that study’s own figures, not properties of the product; the persona and audit prose in the demo corpus is composed, and the header reads demo:offline to say so.
The exchange quoted in “Two answers no one had looked at together” is from the testing record of the grounding work: the same question was put to the same segment more than once, the answer line quoted is one recorded draw’s opening, and the SOUND verdict, the 4-of-5 depth rating and the evaluation sentence quoted are the recorded evaluation of the draw that connected the two questions.
Solvane, Meridian, Emberstream, Orchard Box and Volta Cast are fictional brands.