
We work alongside market research teams and agencies to provide specialist MaxDiff analysis expertise. We analyze your survey data to reveal clear preference priorities, compare subgroups, and turn the results into decision-ready insights.
MaxDiff analysis helps research teams identify what respondents value most when rating scales produce too many similar scores. Instead of asking respondents to rate every item independently, MaxDiff presents a set of items and asks them to choose the most and least preferred. This creates a clearer hierarchy of relative preference.
Instead of asking respondents to rate every feature on a scale, MaxDiff shows them a small set of items and asks them to identify the most preferred and least preferred. Repeating these trade-offs across a balanced design allows you to estimate the relative preference for each item and distinguish items that rating scales often leave too close together.
Rating scales allow respondents to give many items similarly high scores. MaxDiff forces trade-offs, making it easier to distinguish relative preferences across items and markets.
MaxDiff produces scores that can be compared in relative terms. An item with a score twice as large as another represents twice the estimated preference, making the results more useful for analysis and modeling.
MaxDiff does not only identify the items at the top. It also creates separation among lower-ranked items, helping research teams see what matters less and where resources may be better allocated.
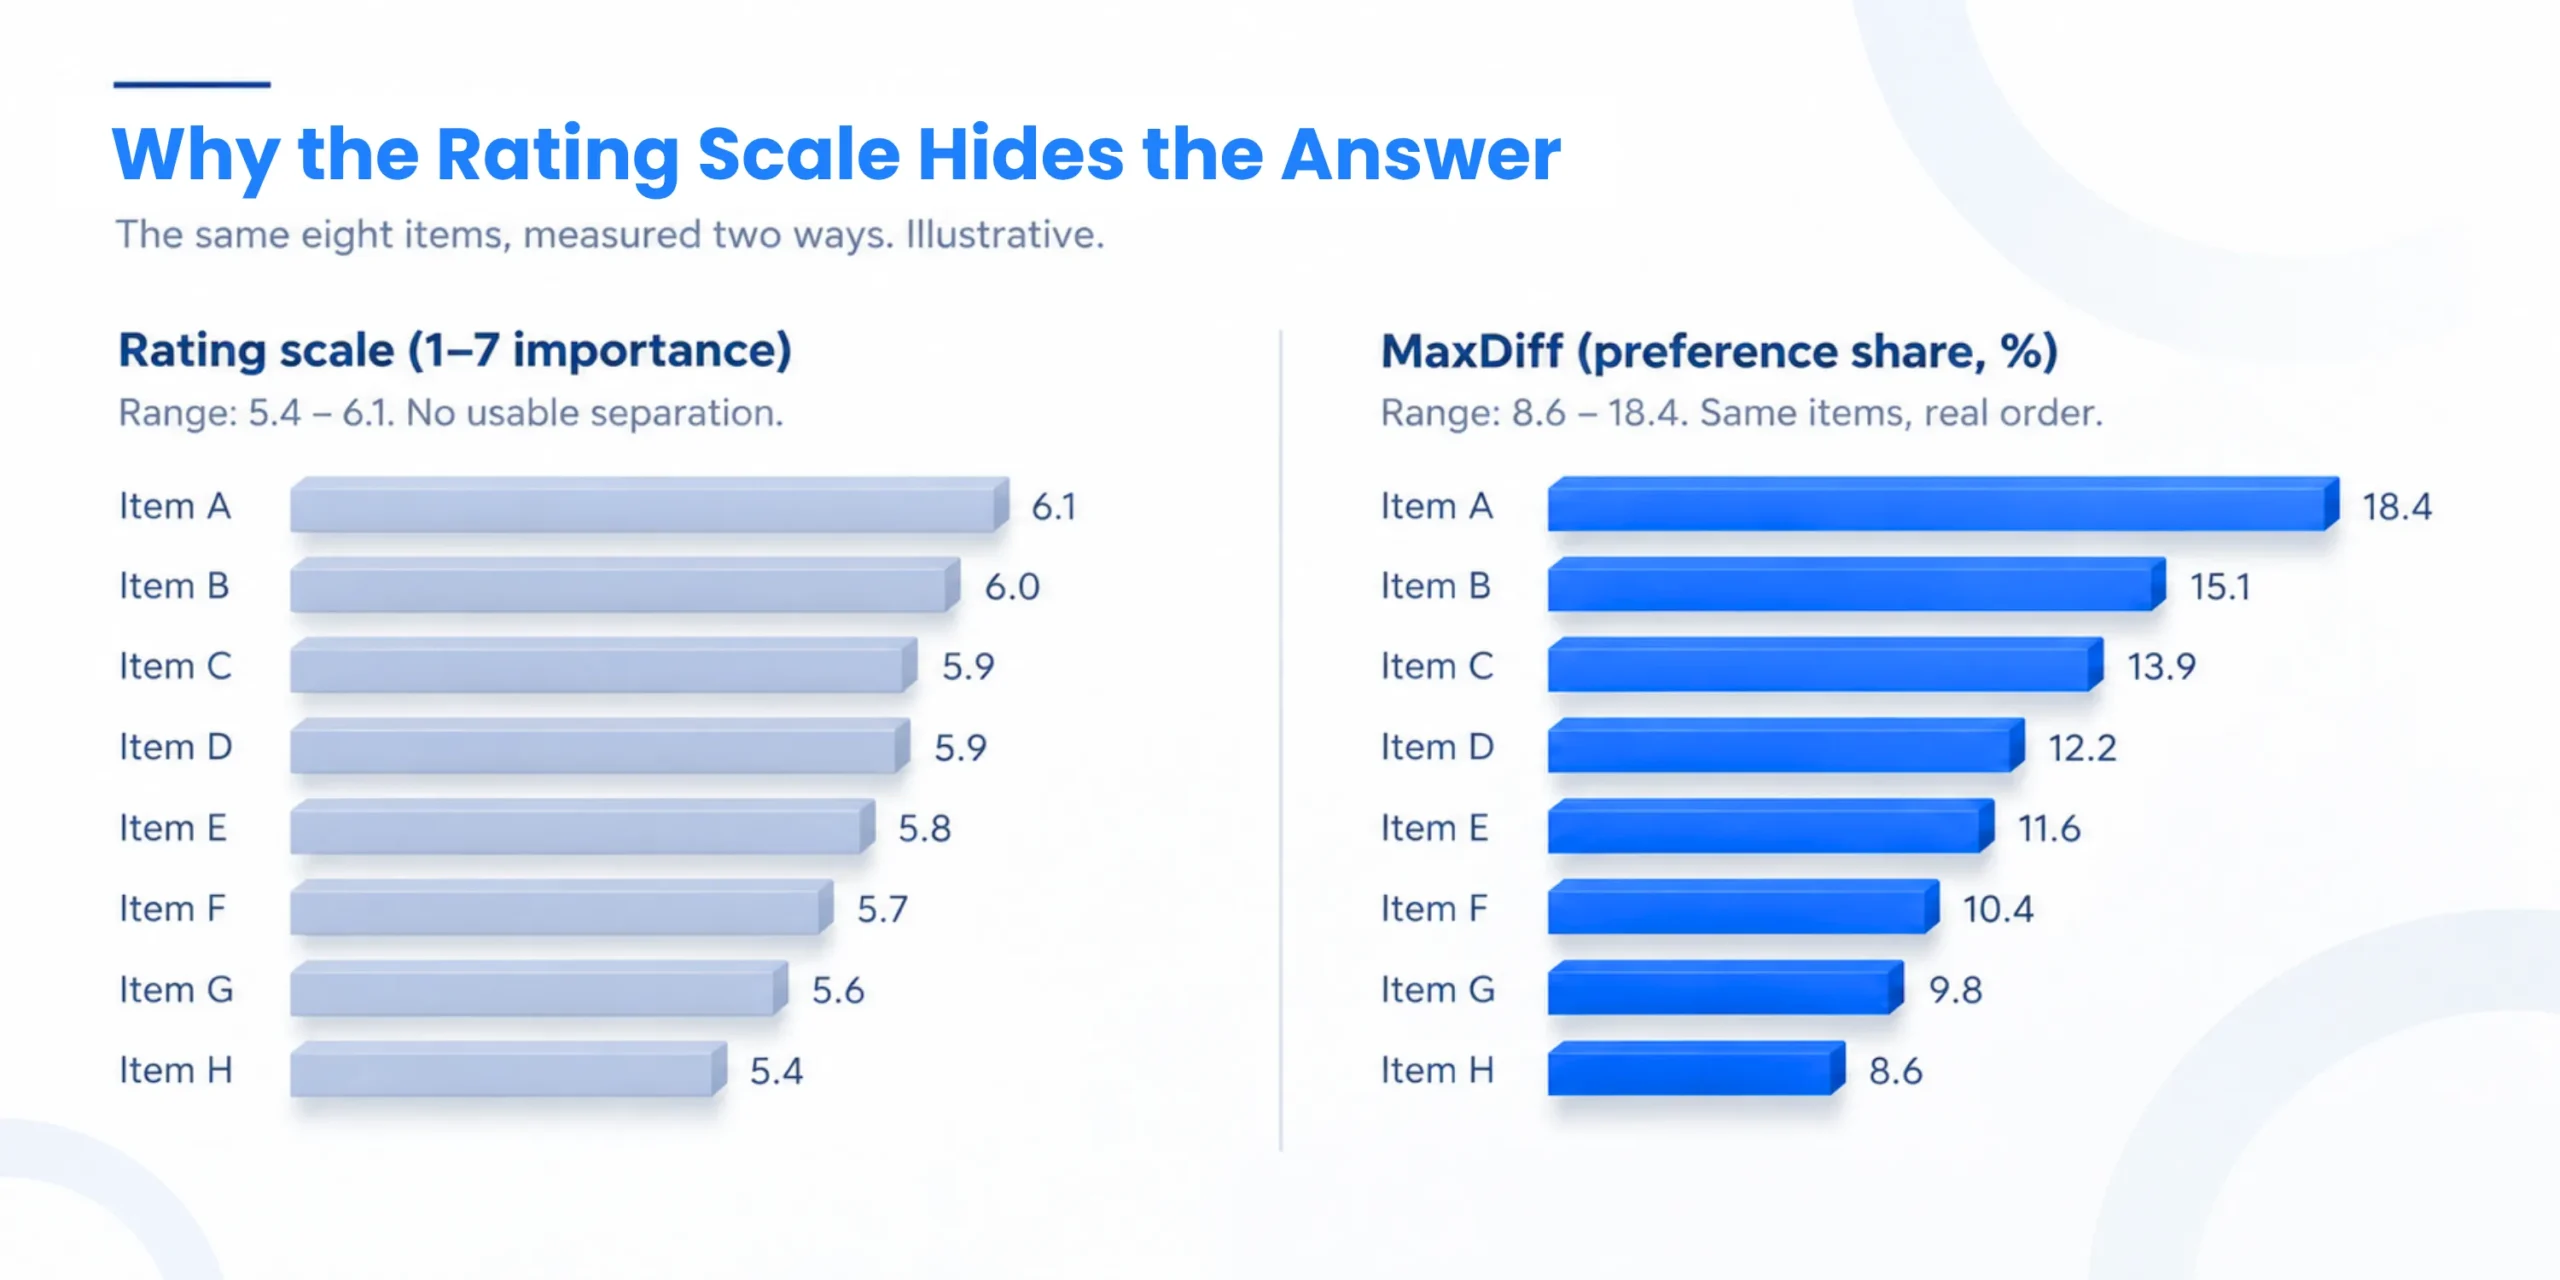
MaxDiff is more than a questionnaire block. The design, estimation and interpretation all affect the quality of the final priority ranking. We work alongside research teams when they need specialist expertise that is difficult to staff in-house.
When many attributes receive similarly high ratings, the research team may have no defensible way to prioritize them. MaxDiff introduces direct trade-offs and produces a clearer relative preference hierarchy.
A MaxDiff study can provide more than an overall ranking. We can analyze subgroup differences, estimate ratio-scaled scores, apply anchors where appropriate, and build outputs your team can use in client discussions.
Bring us into an existing research project when MaxDiff expertise is needed. We can support questionnaire design, analytical decisions, estimation and interpretation without requiring you to add a specialist to your team.
We turn the analysis into clear charts, interpretation and recommended actions that your research team can use in presentations and debriefs. Optional simulators and supporting analyses can extend the value of the study.
Different research questions call for different MaxDiff approaches. We help market research teams select the right design, analysis and supporting methods based on their objectives, item list and reporting needs
A balanced best–worst design across 12–14 screens, with four items per set. It produces a ranked preference hierarchy and ratio-scaled utility scores.
Best for: 20–40 items
Turnaround: 3–4 days
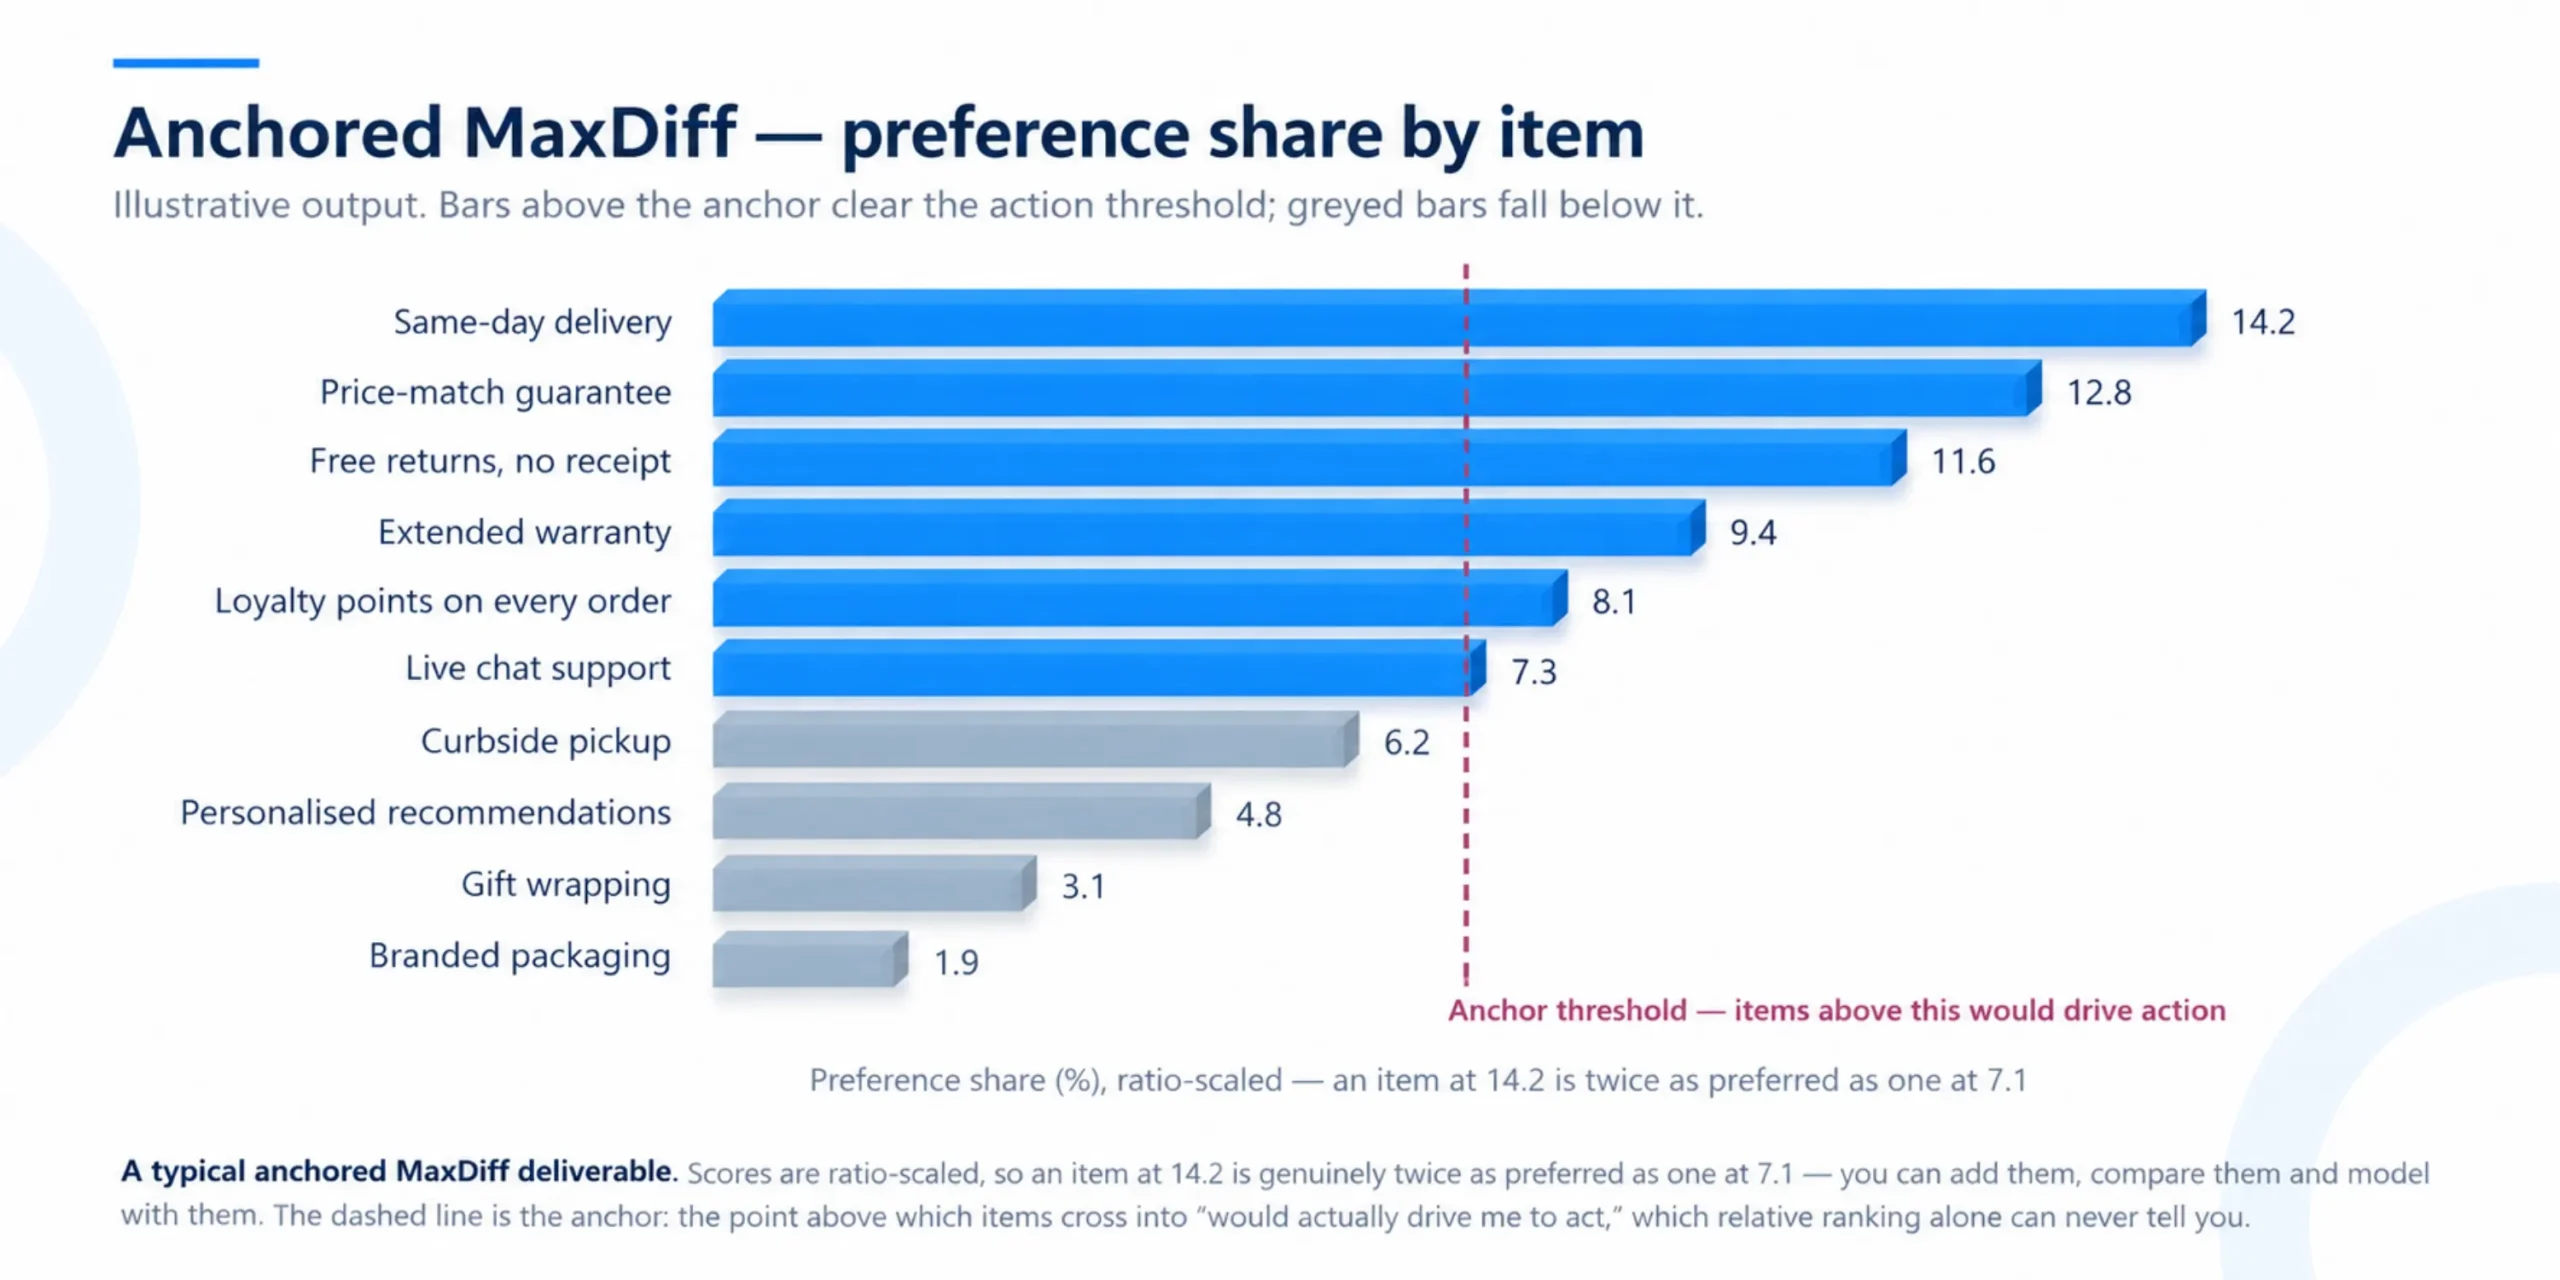
Relative preference tells you which items rank higher, but not whether an item clears a meaningful action threshold. Anchoring adds a purchase or action threshold to help identify which items meet the required bar.
Best for: Go/no-go feature decisions
Turnaround: 3–4 days
When the item list becomes too long for a standard design, adaptive MaxDiff concentrates later tasks on the stronger contenders. This can reduce respondent burden while allowing larger item sets to be evaluated.
Best for: 40–60+ items
Turnaround: 4–5 days
MaxDiff identifies which items are preferred. TURF then evaluates combinations of those items to determine which portfolio, lineup or bundle can reach the greatest unduplicated audience.
Best for: Line-up and bundle decisions
Turnaround: 4–6 days
Turn the MaxDiff results into an interactive tool your client can use after the study. A browser-based or Excel simulator can allow users to filter by subgroup and explore the preference hierarchy.
Best for: Client engagement and repeat use
Turnaround: 5–7 days
MaxDiff can help shortlist the attributes that matter most. A choice model can then evaluate configurations, trade-offs and price. The two methods answer different questions and can work together within the same research program.
Best for: Pricing and product design
Turnaround: Scoped to project
A balanced best–worst design across 12–14 screens, with four items per set. It produces a ranked preference hierarchy and ratio-scaled utility scores.
Best for: 20–40 items
Turnaround: 3–4 days
Relative preference tells you which items rank higher, but not whether an item clears a meaningful action threshold. Anchoring adds a purchase or action threshold to help identify which items meet the required bar.
Best for: Go/no-go feature decisions
Turnaround: 3–4 days
A balanced best–worst design across 12–14 screens, with four items per set. It produces a ranked preference hierarchy and ratio-scaled utility scores.
Best for: 40–60+ items
Turnaround: 4–5 days
MaxDiff identifies which items are preferred. TURF then evaluates combinations of those items to determine which portfolio, lineup or bundle can reach the greatest unduplicated audience.
Best for: Line-up and bundle decisions
Turnaround: 4–6 days
Turn the MaxDiff results into an interactive tool your client can use after the study. A browser-based or Excel simulator can allow users to filter by subgroup and explore the preference hierarchy.
Best for: Client engagement and repeat use
Turnaround: 5–7 days
MaxDiff can help shortlist the attributes that matter most. A choice model can then evaluate configurations, trade-offs and price. The two methods answer different questions and can work together within the same research program.
Best for: Pricing and product design
Turnaround: Scoped to project
MaxDiff and conjoint analysis are both choice-based research methods, but they answer different questions. MaxDiff identifies the relative importance of individual items. Conjoint evaluates trade-offs between attributes, levels and configurations, including price.
The right choice depends on the decision your research needs to support.
MaxDiff and conjoint analysis can be used together when a research program needs both prioritization and configuration or pricing analysis.
| Factor | MaxDiff | Conjoint / DCM |
|---|---|---|
| Primary question | What matters most? | Which option would you choose? |
| Output | Ratio-scaled preference hierarchy | Utilities, share of preference, price sensitivity |
| Best for | Feature, message and attribute prioritization | Product configuration, pricing and market simulation |
| Items / attributes | 20–50+ standalone items | Typically a smaller number of attributes with levels |
| Pricing questions | Not suitable | Strong fit |
| Sample size | 150–300+ | 300–600+ |
| Cognitive load | Lower – respondents evaluate small sets | Higher – respondents compare complete profiles |
| Fieldwork | Can fit within an existing study | Often requires a more involved study design |
A reliable MaxDiff analysis starts with a well-designed study. We review the questionnaire and research objectives before fielding to make sure the design can support the analysis and decisions your team needs to make.
This provides enough item exposure for stable estimates while keeping the task manageable for respondents.
Each item should appear a balanced number of times. An unbalanced design can give items an unintended advantage simply because they appear more often.
Items should be comparable in scope. Mixing a specific feature such as “faster checkout” with a broad statement such as “better overall experience” can distort the results.
A total sample of 150–300+ may support an overall read. If your team needs subgroup results, the sample needs to support the smallest subgroup you intend to report.
Standard MaxDiff provides relative priorities. If you need an absolute action or purchase threshold, the anchor must be included in the questionnaire. It cannot be added after fieldwork.
Client-Ready Ranking Charts
Clear visualizations of the preference hierarchy, showing which items stand out and where meaningful differences appear.
Ratio-Scaled Utility Scores
Preference scores that show the relative strength of each item, providing a more useful basis for comparison than simple rating-scale percentages.
Subgroup Breakouts
Compare preference priorities across relevant segments, markets or respondent groups to identify where priorities differ.
Written Interpretation and Recommended Actions
We translate the statistical output into clear findings and practical implications your research team can use in the final report or debrief.
Anchored Thresholds
When the study includes an appropriate anchor, we can identify which items meet the defined purchase or action threshold rather than only showing their relative rank.
Your MaxDiff analysis should give your research team more than a ranked list. We provide clear outputs that can be used in reporting, client presentations and decision-making.
MaxDiff can produce a strong preference hierarchy, but poor design or interpretation can undermine the results. These are some of the most common issues we see when reviewing MaxDiff studies.
MaxDiff shows what people prioritize. The final decision also depends on factors such as margin, feasibility, strategy, and brand fit.
MaxDiff can produce a strong preference hierarchy, but poor design or interpretation can undermine the results. These are some of the most common issues we see when reviewing MaxDiff studies.
MaxDiff is designed to measure relative preference among items. If the research question is about willingness to pay, price sensitivity or product configurations, a choice-based conjoint approach may be more appropriate.
MaxDiff scores show relative preference. They should not be presented as though they represent the percentage of respondents who would buy, choose or purchase an item.
Items need appropriate and balanced exposure across tasks. Poor balance can make some items easier or harder to choose simply because of how often or where they appear.
Large item lists can increase respondent burden and make the study harder to design well. When the list is extensive, consider whether items can be removed, grouped appropriately or evaluated using an adaptive approach.
A sample that supports an overall ranking may not support reliable subgroup comparisons. Sample requirements should be considered against the segments and decisions the research team plans to report.
Send us the questionnaire and MaxDiff design before fielding. We can review the item structure, design balance, sample plan, and analytical approach before respondents enter the study.
MaxDiff requires more than running an analysis. Study design, estimation and interpretation all affect the quality of the final result. The Analytics Team brings specialist quantitative expertise to market research teams and agencies that need experienced support on MaxDiff projects.
Years Experience
Solutions Evaluated
Enterprise brands supported
Typical analysis turnaround
Dr. Diener trained under Dr. Jordan Louviere and served on the original Best/Worst Scaling research team. Our team brings PhD-level expertise in experimental design and estimation, combined with practical experience translating quantitative results into business decisions.
Rigorous experimental design and statistical estimation.
Turning preference scores into recommendations that support real decisions.
Catching design, data and interpretation issues before they affect the final deliverable.
Presenting technical findings in a form that research teams and their clients can understand and use.
Straightforward pricing for specialist MaxDiff analysis. Choose a standalone analysis, combine MaxDiff with supporting methods, or scope a larger engagement around your research needs.
For a focused MaxDiff analysis using existing survey data, including core analysis and client-ready outputs.
Best for: A single MaxDiff study
Combine MaxDiff with additional analysis such as TURF, KANO, segmentation or other supporting methods.
Best for: Multi-method research programs
For research teams that need recurring MaxDiff, choice modeling or quantitative analytics support across multiple projects.
Best for: Ongoing specialist support
Interactive Profiling Tool
Add approximately one week for an interactive profiling or simulation tool that allows users to explore the results after the analysis.
The source specifically gives +1 week / $2k–$4k for the Interactive Profiling Tool.
Not sure which level of analysis you need? Share your study objectives, item list and data setup. We’ll recommend the appropriate scope.
MaxDiff, or Best–Worst Scaling, asks respondents to identify the most and least preferred item from a small set of alternatives. Repeating these trade-offs across a balanced design allows you to estimate the relative preference for each item and create a clearer priority hierarchy.
Standard MaxDiff produces a relative preference hierarchy. Anchored MaxDiff adds a meaningful threshold, such as a purchase or action threshold, to help determine which items meet the required level.
A standard MaxDiff design typically works well with around 20–40 items. Larger item lists can be accommodated using appropriate designs, including adaptive approaches. The right number depends on the research objectives, questionnaire design and sample.
An overall analysis may be supported with approximately 150–300+ completes. If you need reliable subgroup comparisons, the sample should be planned around the size of the smallest subgroup you intend to analyze.
We can work with common research data formats including SPSS, Excel and CSV. If your data is provided in another format, share the file structure and we’ll confirm whether it can be accommodated.
Yes. MaxDiff can identify which features respondents value most, while KANO can provide a complementary perspective on how features affect satisfaction. The two methods can be used together when the research objectives call for both perspectives.
Yes. MaxDiff can identify the items with the strongest preference, while TURF can evaluate combinations of those items to determine which portfolio or lineup reaches the greatest unduplicated audience.
Yes. We can support your team with methodology recommendations, scope, analytical approach and proposal language when MaxDiff expertise is needed.
Yes. An interactive simulator can be added to the analysis so clients can explore preference results by subgroup and examine different views of the findings after the study.
A typical standalone MaxDiff analysis takes 3–4 business days, depending on the scope, data quality and required outputs.
Standalone MaxDiff analysis typically ranges from $500–$2,500. Larger engagements combining MaxDiff with supporting analyses are typically $2,500–$6,000. Interactive tools and other requirements can be scoped separately.
Every couple of months, receive insightful blog entries that use case studies, examples and demonstrations to show you how to get the most out of your advanced analytics and to see dangers you can avoid. This is a new series of posts that come directly from real experience happening right now!


